Breaking the ICE

Peter Sefton at University of Southern Queensland (USQ) has developed a well-thought-out and engineered system for authoring semantic documents.  We talked earlier this year at ETD2007 (blogged). Now he writes about how to get it adopted: Breaking the ICE

Over the last couple of mo[n]ths we’ve been breaking the ICE. That is, we have been taking the big, complex Integrated Content Environment and making it easier to use just parts of it.
It’s hard not to notice that the only place where full-blown ICE is used much is at USQ, in that environment we have a hundred plus users, and growing steadily, but the external teams we’ve tried to get using ICE have all been slow to adopt it.
I have been thinking a lot about why this is.

  • It’s too hard to install and set up, including the server-side components. (We’re working on making it easier, bit by bit).
  • People don’t perceive a need for HTML and PDF versions of their documents (although many do, and there are some supporters out there).
  • At USQ our academic staff are used to creating book-length distance-ready course content and we push hard for flexible delivery, so people do want HTML and PDF versions of content. Other places there’s not the same culture.

PMR: I know how Peter feels. Any of us who create systems that will make the world better wonder why there isn’t an uprush of people wanting to take them up. Despite the apparent mad rush in Web 2.0, Piet Hein had it right in his “grook“. In the academic world TTT – Things Take Time (reposted with affection, if not permission):

T. T. T.
Put up in a place
where it's easy to see
the cryptic admonishment
T. T. T.
When you feel how depressingly
slowly you climb,
it's well to remember that
Things Take Time.

I don’t know Peter’s colleagues in USQ (I hope to meet some in February) but I am willing to bet that he has found one or more people with the characteristics:

  • they share Peter’s vision
  • they have a real job of work to do for which ICE is suitable
  • they know Peter well enough to trust there is a measure of stability in the system
  • they share beers

Now I would like to use ICE. I think it’s the right way to go for embedding markup such as CML in documents. But I don’t have a need to use it. And I don’t have a colleague who has a need to use it. And I’m not going to rush up to an unknown colleague and persuade them to use a system that they might need just because I think it’s good.
We face the same problem with SPECTRa : Submission, Preservation and Exposure of Chemistry The system is designed for the deposition of chemistry data (crystallography, NMR, computational chemistry) in repositories. But it won’t be used unless we are able to persuade someone to change their business process and that will take time and effort and possibly investment. So it’s a selling job. How do we sell it? Stick or carrot? We have no stick (the time may come when the Research Councils mandate deposition, but we aren’t quite there yet). So we have to show a Chemistry Department (note, probably not a complete institution) that it will do wonderful things for them. Will it? Perhaps by combining it with CrystalEye – which will show the results of harvesting the departmental data. Giving a show window onto the data for both the inmates and the outside world. Making it easier for researchers to find their own data which they had untill yesterday – somewhere – until it disappeared.
So ICE, SPECTRa, etc. need lots of patience, constant improvement, gentle selling. Gradually there will be an uptake, and then at some stage it will take off. Months? Years? We can’t tell, but we have to be prepared for a long haul.

Posted in Uncategorized | 1 Comment

Give Us the Data Raw, and Give it to Us Now

Rufus Pollock (OKFN) expresses a common sentiment Give Us the Data Raw, and Give it to Us Now

One thing I find remarkable about many data projects is how much effort goes into developing a shiny front-end for the material. Now I’m not knocking shiny front-ends, they’re important for providing a way for many users to get at the material (and very useful for demonstrating to funders where all the money went). But shiny front ends (SFEs from now on) do have various drawbacks:
  • They often take over completely and start acting as a restriction on the way you can get data out of the system. (A classic example of this is the Millenium Development Goals website which has lots of shiny ajax which actually make it really hard to grab all of the data out of the system — please, please just give me a plain old csv file and a plain old url).
  • Even if the SFE doesn’t actually get in the way, they do take money away from the central job of getting the data out there in a simple form, and …
  • They tend to date rapidly. Think what a website designed five years ago looks like today (hello css). Then think about what will happen to that nifty ajax+css work you’ve just done. By contrast ascii text, csv files and plain old sql dumps (at least if done with some respect for the ascii standard) don’t date — they remain forever in style.
  • They reflect an interface centric, rather than data centric, point of view. This is wrong. Many interfaces can be written to that data (and not just a web one) and it is likely (if not certain) that a better interface will be written by someone else (albeit perhaps with some delay). Furthermore the data can be used for many other purposes than read-only access. To summarize: The data is primary, the interface secondary.
  • Taking this issue further, for many projects, because the interface is taken as primary, the data does not get released until the interface has been developed. This can cause significant delay in getting access to that data.

When such points are made people often reply: “But you don’t want the data raw, in all its complexity. We need to clean it up and present it for you.” To which we should reply:
“No, we want the data raw, and we want the data now”

PMR: I have sympathy for this motivation and we’ve seen a fair amount of traffic on this blog basically saying “Give us the data now in a form we know and understand“. And it’s taking longer than we thought because the data aren’t in a form that is easily dealt with. Not because we have built a SFE, but because the data “just grew”. It’s probably fair to say that making material available in HTML helps to promote the demand for the data but may hinder the structure.
What we have learnt is that each person has an implicit information environment which may be difficult to transport. It isn’t just one giant CSV file, it’s lot of submit scripts, scraping tools, etc. It is currently easier to ask Nick Day to run jobs in his environment that abstract them into mine. It will have to be done, but it’s harder than we budget for.
So one of the benefits of Open Data – albeit it painful – is that when you are asked for it, it helps if it’s structured well. That structure doesn’t evolve naturally – it has to be thought about. There is actually no raw data. There’s chunks of data mixed with metadata (often implicit) and tied together with strings of process glue. We’ll know better next time.

Posted in data, open issues | 5 Comments

Students and the Scholarly revolution

Gavin Baker, Student activism: How students use the scholarly communication system, College & Research Libraries News, November 10, 2007. (Peter Suber’s excerpt)

Faculty aren’t the only users of the scholarly communication system. Students also depend on it for their education, research, and to disseminate their own ideas. And students, like faculty, have taken action to broaden access to the academic literature and maximize the value of this important resource….
How students participate in the scholarly communication system
1. Students are users of journal literature. The research paper is a staple of student life…and broad access to the literature enhances the student’s education.
[S]tudents are frequently  assigned journal literature as class readings in addition to, or in place of, textbooks….[I]n classes that rely on large numbers of journal articles, students often are required to purchase a coursepack or sourcebook containing the readings…The cost of these coursepacks can rival the cost of textbooks. Unlike textbooks, however, coursepacks often have no resale value….
2. Students are authors of journal literature. Some students, particularly graduate students, will have the occasion to publish their work in a scholarly journal, often coauthored with a faculty mentor….
3. Students are editors of scholarly journals….In addition to student journals, students also edit professional scholarly journals. Law reviews, for example, are frequently wholly student-edited….
4. Students are constituents of the scholarly communication system. Students are a constituency of university governance—often formally, such as through a student government or graduate student council….
Finally, students are also citizens and taxpayers, who have an interest in maximizing the public investment in science, just like any other taxpayer.

PMR: For me the most exciting aspect is that students can change the scholarly communication system. Our OSCAR system, seen in part in the Royal Society of Chemistry’s Experimental Data Checker, was developed by undergraduate students, some in their second year. Students have the power to change the way that chemistry is ommunicated and I expect that, given support and not opposition from faculty, they will make important contributions. But I am sure many faculty undervalue the public creativity of their students.

Posted in open issues | Leave a comment

Open Data and Moral Rights

Kaitlin Thaney, Project Manager, Science Commons pointed me to her colleague’s post on moral rights. “Our legal counsel, Thinh Nguyen has just posted a bit on the relationship between and issues regarding CC licenses, OA and moral rights. Worth a read. http://sciencecommons.org/weblog/archives/2007/11/07/cc-oa-moral-rights/.
Certainly worth a read. Some exceprts:
A question that we often see in connection with the use of Creative Commons licenses in OA publishing is how the Creative Commons licenses, (and in particular CC-BY) affect moral rights. One example is this post on the topic by Peter Suber.From the perspective of moral rights, the Creative Commons licenses start with a simple proposition: They don’t affect moral rights….

So one question comes up a lot: how is it consistent to have a license (such as CC-BY) that allows derivative works to be made while at the same time recognizing that the author reserves his moral rights? Isn’t any derivative work an infringement of moral rights, when they exist? Not necessarily. Moral rights exist to protect the reputation of the author.
So the right of integrity, which bars distortion, alteration or mutilation of the work, does not necessarily bar all derivative works, but only those that are harmful to the reputation of the author….
PMR: This is useful, in that it shows that there are additional jurisdictions whuch may protect the author’s moral rights. For Open Data what are these and should they always be respected?There are several reasons for making data Open, and they may imply different moral rights. Here are some:
  • to make available the record of science. In this case it is important to distinguish the primary “copy” of the work and to be clear that derivative works – whatever their added or subtracted value are NOT the original. It is important not to rewrite history without metadata. It is likely that in a very few years almost all science PhD theses will be mandated to be Open.
  • to provide a definitive statement of a set of data – often called “reference data” or “critical data”. This is frequently done by standards bodies and International Scientific Unions. These represent the collective wisdom of the community and if, for example, they announce a critical value for the speed of light or the genome of a species it is important to honour this. A creator of derivatives works, perhaps by mashup, incorporation into a program or annotation has a duty of care to make sure that the quality of the original is not deliberately or inadvertently corrupted.
  • to aggregate and re-use the works of others (this is the case with CrystalEye). Here we have a duty to make sure that the original work is properly referenced, that we do not introduce corruption and that if we do it is correctly as soon as reasonable.

But should we bar “derivative works […] that are harmful to the reputation of the author….”? Science requires that the work be published and criticized. The criticism can be that the data are suspect, the logic is flawed or that the work is not novel. It would be reasonable – and in some cases mandatory – to make such criticism public. It might include the creation of derivative works which take the data and rework it. If compelling, such works may very well be harmful to the reputation of the author. A typical example, where data are reworked can be seen here (where the quality of data in NMRShiftDB are challenged). This is an acceptable derivative work and the reader can make their own mind up whether its argumants are compelling. It would be quite unacceptable for any author to forbid this under “no derivative works”.
On the other hand there are derivative works that many would find unacceptable. If we use CC-BY then we are allowing (and maybe even encouraging) others to rework our material for profit. It would be acceptable to re-purpose the work in a framework which contained advertising – we might not like it, but we have to accept the logic. It might be used – possible spuriously – to justify a political or pseudoscientific view (e.g. creationism) that we find unacceptable. But again we cannot use CC-BY to forbid this.
So the conclusion must be that legal licences are only part of the approach. We need to consider authors’ moral rights to Data as an additional concern. And we need to realise that in the modern world the work may be more that the simple content. The hypermedia and the metadata may be integral parts of the work and we should be aware to this.

Posted in data, open issues | Leave a comment

Unlock the PDFs

Heather Morrison shows how “locked” PDFs disadvantage the print disabled.

Via Peter Suber: Heather Morrison, Unlock the PDFs, for the print disabled (and open access, too), a posting to SOAF and other lists, November 6, 2007.  Excerpt:

For the print disabled, the difference between a PDF that is locked down and one that is not, is the difference between a work that is accessible, and one that is one.
A locked PDF is an image file, with inaccessible text. An unlocked PDF has text that is accessible, that can be manipulated by screen readers designed for the print disabled. Even without special equipment, is it easy to see how an unlocked PDF can very easily be transformed into large print, or read aloud.
Publishers, please unlock your PDFs! Librarians, please ask about unlocked PDFs when you purchase.
The Budapest Open Access Initiative did not aim to meet the needs of the print disabled. This is just another side-benefit of open access.

PS: Comment.  Exactly.  If publishers insist on using PDFs at all, then at least they should unlock them.  To facilitate re-use even further, they should offer HTML or XML editions alongside the PDFs.

PMR:  It isn’t just the print-disabled. After working with PDFs for several years I am now brain-disabled. And they are destroying our productivity.  I’m serious. Our SPECTRa-T (Submission, Preservation and Exposure of Chemistry in Theses) project has been looking at how to extract chemistry from PDF theses. It’s worse than I ever thought.  Some theses emit non-printing characters. I can’t show them in this post because they are non-printing. But they break XML files. Just one of many  PDF bugs  that have slowed us down.
siht ekil tuoemac eno rehtonA
It really did.
None of these theses was original written in PDF. It was written in TeX, or DOC or…  It’s been turned into PDF because people think it looks nice.
It might on the surface. Underneath it is one of the most prurulent and corruptive systems ever disguised. Don’t use it if you can help it. And if you can’t help it, do what Peter suggests – accompany it with the XML or HTML. They may be not quite so nice on the surface but underneath they’re lovely.

Posted in Uncategorized | 2 Comments

Open NMR: Nick Day's "final" results

Nick has more-or-less finished the computational NMR work on compounds from NMRShiftDB and we are exposing as much of the work as technically possible. Here is his interim report, some of which I trailed yesterday. The theoretical calculation (rmpw1pw91/6-31g(d,p)) involves:

  • correction for spin-orbit coupling in C-Cl (-3 ppm) and C-Br (-12 ppm)
  • averaging of chemically identical carbons (solves some, but not all conformational problems)
  • extra basis set for C and O [below]

====== Gaussian 03 ====
–Link1–
%chk=nmrshiftdb2189-1.chk
# rmpw1pw91/6-31g(d,p) NMR scrf(cpcm,solvent=Acetone) ExtraBasis
Calculating GIAO-shifts.
0 1
C 0
SP 1 1.00
0.05 1.00000000 1.00000000
****
O 0
SP 1 1.00
0.070000 1.0000000 1.0000000
****
====== Gaussian 03 ====
In general his/our conclusions are:

  • the major variance in the observed-calculated variate is due to “experimental” problems (“wrong” structures, misassignments)
  • significant variance from unresolved conformers and tautomers
  • small systematic effects in the offset depending on the hybridization [below]

The final variance is shown here (interactive plot at (http://wwmm.ch.cam.ac.uk/data/nmr/html/hsr1_hal_morgan/solvents-difference/index.html) requires Firefox):
nick1.PNG
(In the interactive plot clicking on any point brings up the structure, and the various diagnostics plots can then be loadad for that structure). It can be seen that the sp3 Carbons (left) are systematically different from the sp2 (right) and we shall be playing with the basis sets to see if we can get this better. If not it will have to be an empirical calculation.
The variance can be plotted per structure in terms of absolute error (C) and intra-structure variance (RMSD). Here’s the plot (http://wwmm.ch.cam.ac.uk/data/nmr/html/hsr1_hal_morgan/RMSD-vs-C/index.html) for this (which obviously includes some of the variance from the systematic error above):
nick2.PNG
The sp2/sp3 scatter can be seen at the left but the main RMSD (> 3.0 ppm) is probably due to bad structures and unresolved chemistry. There are 22 points there and we’d be very grateful for informed comment.
Assuming the main outliers can be discarded for legitimate reasons (not just because we don’t like them) then I think we have the following conclusion. For molecules with:

  • one major conformation …
  • … and where there are no tautomers or we have got the major one …
  • … and where the molecule contains only C, H, B, N, O, F, Si, P, S, Cl, Br …

then the error to be expected from the calculation is in the range 1-2 ppm.
We can’t go any further without having a cleaner dataset. We’d be very interested if anyone can make one Open. But we have also have some ideas how to start building one and we’d be interested in collaborators.
We’ve now essentially exposed all or methodology and data. OK, it wasn’t Open Notebook Science because there were times when we didn’t expose things. But from now on we shall try to do it as full Open Notebook Science. There may be some manual procedures in transferring results from the Condor system to web pages, but that’s no different from writing down observations in a notebook – there will be a few minutes between the experiment and the broadcast. And this will be an experiment where anyone can be involved.

Posted in nmr, open issues | 16 Comments

CrystalEye: using the harvester

Jim Downing has written a harvester for CrystalEye. I thought I would have a try and see if I could iterate through all the entries and extract the temperature of the experiment. This is where XML really starts to show its value over legacy formats. Jim’s iterator reads each entry and copies it to a file; I decided to read the entry as an XML document, search for the temperature using XQuery and announce it. It’s simple enough that I thought I could do it while watching Liverpool (I used to live on Merseyside). Unfortunately (or fortunately) the torrent of goals distracted me so it had to wait till today.
The temperature is described in the IUCr dictionary and held in CML as (example):
293.0
So this is trivially locatable by XQuery (with local-name() and @dictRef):
// iterate through all entries
for (DataEntry de : doc.getDataEnclosures()) {
if (downloaded >= maxHarvest) {
return downloaded;
}
InputStream in = null;
try {
in = get(de.url);
// standard XOM XML parsing, creates a
Element rootElement = new Builder().build(in).getRootElement();
// standard xquery
Nodes nodes = rootElement.query(
".//*[local-name()='scalar'"+
and @dictRef='iucr:_cell_measurement_temperature']");
// if there is a temperatute extract the value
String temp = (nodes.size() == 0) ? "no temp given" : nodes.get(0).getValue();
System.out.println("temperature for "+rootElement.getAttributeValue("id")+": "+temp);
downloaded++;
} catch (Exception e) {
e.printStackTrace();
} finally {
IOUtils.closeQuietly(in);
}
}
and here’s the output: 1625 [main] DEBUG uk.ac.cam.ch.wwmm.crystaleye.client.Harvester - Getting http://wwmm.ch.cam.ac.uk/crystaleye/summary/rsc/ob/2007/22/data/b712503h/b712503hsup1_pob0401m/b712503hsup1_pob0401m.complete.cml.xml
temperature for rsc_ob_2007_22_b712503hsup1_pob0401m: 115.0
2297 [main] DEBUG uk.ac.cam.ch.wwmm.crystaleye.client.Harvester - Getting http://wwmm.ch.cam.ac.uk/crystaleye/summary/rsc/ob/2007/22/data/b710487a/b710487asup1_ljf130/b710487asup1_ljf130.complete.cml.xml
temperature for rsc_ob_2007_22_b710487asup1_ljf130: 150.0

etc.
It will take the best part of the day to iterate through the entries, but remember that CrystalEye is not a database. We are converting it to RDF (and anyone interested can also do this) when it can be searched in a trivial amount of time and with much more complex questions. (Remember that CrystalEye was not originally designed as a public resource). Until then anyone who wishes to use CrystalEye a lot would do best to download the entries and build their own index.
[Note: I will continue to try to format the code – WordPress makes it very difficult]

Posted in crystaleye | 1 Comment

Open Learn

From the Open Knowledge Foundation blog

Last week I [?Jonathan Gray?] went to the OpenLearn 2007 conference hosted at the Open University. A lot was packed into the couple of days, and there was representation from different OER (Open Educational Resources) groups from around the world. There were an abundance of new projects, papers, groups and initiatives mentioned, and a recurring sentiment was that it is difficult to keep track of all the things that are happening!
In terms of coverage: on-the-fly notes from conference bloggers are available from OCHRE and other blog posts should appear at the OpenLearn blog aggregator. I think the OU also intend to release video/audio footage of the conference.
[… ideas of Open learning snipped …]
Conceptions of ‘Openness’ and licensing practices
It was clear listening to the different talks that there were various different conceptions about what the ‘open’ in OER meant. There was certainly a strong sense that it is fundamentally related to liberal/open licensing practices (as opposed to just cost-free access) but it often seemed to have wider connotations than this. Erik Duval said that to him openness meant ‘removing barriers’ – including legal barriers, poor findability, and inconvenience to the user. Removing socio-economic obstacles to access, allowing access to source files, and creating a culture of inclusion and participation were recurring themes. I would be interested to hear more about how more people involved in OER felt about the Open Knowledge Definition!
Regarding licensing practices, speakers rarely made distinctions between different types of Creative Commons licenses. The term ‘open content’ was often taken to include material available under a license with noncommercial restrictions. In conversations I had about licenses with noncommercial restrictions (notably with people from MIT and the OU) – I was given the impression that many organisations were not opposed to the commercial usage of educational resources in principle. Commonly cited reasons for adopting one included wanting to incorporate other material available under noncommercial sharealike licenses (especially that which had been donated by other commercial organisations), the reluctance of content contributors (publishers, authors, educators, researchers…) and other parties, and wanting to prevent people mirroring with ads.
It would be great if more OER projects started using licenses requiring only attribution, or attribution sharealike so as to impose minimal restrictions on re-use! The absence of noncommercial restrictions could allow people to experiment with new models for sustaining the development of educational materials.

PMR: We’ve got an an enormous opportunity in chemistry. It’s an excellent subject for participation and creating Open materials. There’s a good history of publicly created material (several Molecule-of-the-Month projects) that would be ideal candidates for Open resources. And let’s make them CC-BY (you’ll note that this blog has finally got its act together – thank you Jim).

Posted in open issues | Leave a comment

Open NMR: Nick Day's misassignment detector plot

It has become clear that a number of structures in the NMRShiftDB data set probably have misassigned peaks. A very common situation is where two peaks are misassigned to a pair of atoms (i.e. peakA is assigned to atomA and peakB to atomB, where it should be peakA to atomB and peakB to atomA). This has a fairly characteristic  pattern on the obs vs. calc plot if the effect is large:
10005648.PNG
where the peak (134 ppm) should be assigned to the atom ortho to the CN and the peak 125 should be assigned to the circled atom.
When the efect is smaller it’s easier to miss, so Nick has transformed the data by plotting X = (obs + calc)/2 and Y = calc – obs. (equivalent to rotating the data by 45 deg clockwise) It’s the same data but the effect is then dramatic.
10005648d.PNG
The misassignment is marked by two peaks at the same average value but displaced roughly equal amounts above and below the rest of the data. It’s also much clearer what the offset is – this data runs at approximately -3 +- 1 ppm – i.e. the precision seems to be very high.
The offset could be due to errors in reporting the shift, errors in using/calculating TMS (if it was used to calibrate) or other absolute errors in the GIAO method. But it’s clear that within a particular sample assignments can be validated to limits of 1-2 ppm. That’s good news if it’s universal.

Posted in nmr | 1 Comment

Open NMR: Update

Prompted by an enquiry today [below] it’s a good time to update about the project. I haven’t talked to Nick today but he mailed earlier and I’ll quote from his mail, which we hope to post in full when we meet. In general from now on we’d like to make the info as public as possible.

Brent Lefebvre Says:
November 6th, 2007 at 2:49 pm e
Hi Peter,
Have you come to a conclusion? I feel that most of the responders to this blog posting have been supportive of the initiative. Please know that what Ryan Sasaki says is true; we are interested in quality science and furthering this where we can. The reason I offered to help is two-fold. We are interested in how our NMR spectrum prediction algorithms compare to the calculation methods you are proposing to use. By using this dataset as a benchmark, I think we can help this project. And if we can help this project, I hope that helps this scientific discipline, if only modestly.
Of course, our motives are not entirely altruistic. By having this benchmark test performed, we get to see how our prediction algorithms compare to the ones you are using. This can then tell us where we need to go and improve our prediction quality, which is of course, very valuable information.
I also have no problem providing you with the results of the predictions, but with the software capable of providing you with the results independently. This should assuage any fears you have of overfitting the data.
Please contact me directly if you wish to puruse this direction. We would be very happy to help.
Sincerely,
Brent Lefebvre
NMR Product Manager
Advanced Chemistry Development

PMR: We are happy to make the dataset available, but please be aware of its limitations which may disappoint you. Let me recap the design of Nick’s project which we managed to stick to:

  • Could we take a heterogeneous dataset of NMR shifts and investigate whether a computational method was suitable for predicting the NMR shifts? In doing this we were aware that we would have to separate experimental variance from errors in the predictive method. When we started we had no idea of the balance between these. It could be that the experiment was very well defined and the computation poor. Or any other proportion.
  • Our ultimate goal is to see whether the chemical literature as published can be analysed in this way. Could the algorithm detect errors in shifts and their assignments? If it could it would act as a robot validator for NMR during the authoring and publishing process. We have already done this for some of the data with the experimental data checker that we developed with RSC sponsorship – we wished to extend this to NMR.
  • Henry Rzepa had already developed the methodology, based on work by Scott Rychnovsky and he was keen to try it out. We had already shown that the method worked for validating crystallography and it was technically straightforward to adapt it to NMR.
  • We needed a set of experimental shifts with assignments. We work closely with Christoph Steinbeck AND because his database emits CMLSpect including 3D coordinates and assignments we can automatically convert the data into Gaussian input files. I repeat that I personally had no experience of the data within NMR shiftDB (and I certainly had some surprises).

Here are some excerpts from Nick’s account (I won’t post it all until I have checked that it’s OK with him). The full account has many hyperlinks and interactive displays so it’s worth waiting for:

We started off by downloading the CML files for all molecules in NMRShiftDB from here. From these we selected molecules that matched the following criteria:

  • must only contain the atoms H, B, C, N, O, F, Si, P, S, Cl, Br, I
  • must have MW < 300
  • must not have a chain of more than two non-H atoms
  • must have at least one CMLSpectrum for 13C NMR where:
  • solvent is provided
  • number of carbons in the spectrum must be equal to the number in the structure.

… and …

… we then attempted to find structures/assignments that were in error.

  • The two structures with highest and lowest C values [PMR: offsets from TMS] are tautomers, and on investigating further with Christoph Steinbeck, we discovered that these structures had originated from the same NMR experiment, the peaks having been incorrectly manually separated before being deposited in NMRShiftDB. [PMR: This was human editing, which introduced massive errors]
  • The structure with highest RMSD was highlighted on PMR’s blog, and through community discussion (notably with Wolfgang Robien and ‘hko’ (blog commenter name) it was decided that this structure was most likely incorrect.
  • It was pointed out (by Wolfgang Robien) that judging from the paper for nmrshiftdb2562 it was likely that the structure given was incorrect for the spectrum.
  • nmrshiftdb10008656 and nmrshiftdb10006416 we judged to have peaks that had been misassigned (these have now been corrected in NMRShiftDB).

All of the structures mentioned above were removed from further analysis.

Conformations

As only one geometry has been calculated for each structure, carbons that in reality are environmentally equivalent can be calculated to have different chemical shifts . To take this into account we used JUMBO to read in the CML files, calculate the Morgan numbers for each carbon, and average the shifts for those that were equivalent.
In many cases the problem cannot be solved this way, and some sort of conformational analysis would be needed to better predict the shifts for less rigid molecules using this method. As we are on a reasonably tight schedule, this will have to be left for another time. Thus, we removed all molecules with rings of 7 or more atoms and any molecules with likely tautomers from the dataset. This left ?? molecules to analyse.

Finding possible peak misassignments

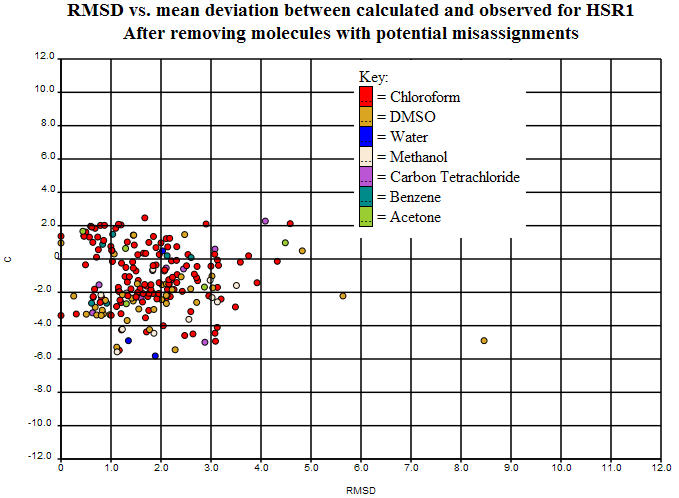
By plotting the average of observed and calculated shift against the difference between observed and calculated shift, it is possible to spot potential misassignments by looking for two points with the same x-values. In this case we’ll only mark a structure as potentially misassigned if the two peaks in question are greater than 2ppm apart. We ran a simple program over the dataset to pick out potential misassignments, and of the 249 structures left, it came up with 42 potential misassignments. The list of these (with their associated ‘misassignment’ plots) can be viewed [… tomorrow …].
Removing the potential misassignments leaves us with 207 structures,

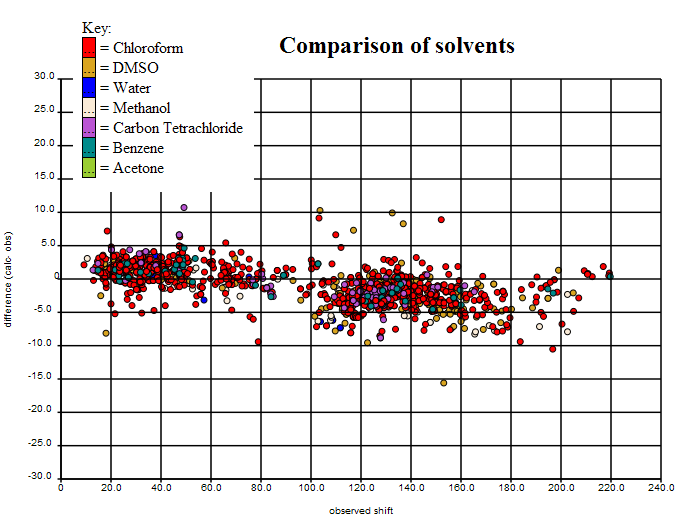
PMR: We shall expose all data to the community. What is clear is that apart from the (expected) problems of halogens all the major variance seems to be due to experimental error. (Joe Townsend found exactly the same for crystallography – the QM methods are good at calculating geometry and good at calculating 13C).
So we are left with 207 structures that may be of good enough quality to start showing “real” variance. We know some of that is “chemical” conformations, tautomers, etc. We would expect that some is due to experimental error that is not easily identified. Some will probably be due to solvent. So only after removing these will we have a data set which is good enough to test predictive methods.
IFF, and I’d welcome the community’s comments, the data set is felt to be relatively clean then it could be a useful tool for comparing methods. But it’s relatively small and it’s probably still got errors in. If the errors are significant then it may not be a very useful test between methods.
My guess is that HOSE/NN and GIAO address problems in different ways:

  • HOSE/NN will be easier to use on structures that have a number of low-energy conformers. It will be trained to give an average value whereas the GIAO method will give results for s single conformer (unless we deliberately search conformational space).
  • HOSE/NN may adjust to tautomers (I don’t know) whereas if the “wrong” tautomer is chosen for GIAO it probably won’t give good agreement.
  • GIAO will be better for rarely observed systems as it should be roughly independent of the atoms and their bonding.
  • All methods may have virtues and defects in modelling solvation.
  • GIAO is potentially capable of showing systematic errors in the data that would be absorbed by HOSE/NN methods

So when I have talked to Nick we’ll make the data and its navigation public. But the primary effact will still be asking the communitty to annotate the outliers, probably as errors. And the only allowed approaches are:

  • revisit the original literature and agree it’s faulty
  • write to the authors and get clarification
  • create a consensus among NMR experts that a particular structure “must be wrong”.

This is a painfully slow (but necessary) way of building up a test data set. It’s what we have to do in natural language processing where each paper is hand-annotated. So if anyone has already done some of this and has a data set which is validated and Open it would be a very useful tool. The problem for GIAO is that – initially – we need fairly rigid molecules (though I think we can extend in the future).

Posted in nmr, open issues | 2 Comments