It has become clear that a number of structures in the NMRShiftDB data set probably have misassigned peaks. A very common situation is where two peaks are misassigned to a pair of atoms (i.e. peakA is assigned to atomA and peakB to atomB, where it should be peakA to atomB and peakB to atomA). This has a fairly characteristic pattern on the obs vs. calc plot if the effect is large:
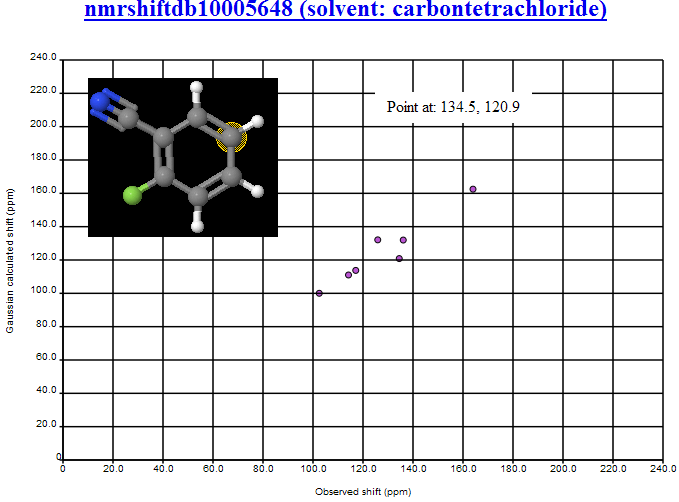
where the peak (134 ppm) should be assigned to the atom ortho to the CN and the peak 125 should be assigned to the circled atom.
When the efect is smaller it’s easier to miss, so Nick has transformed the data by plotting X = (obs + calc)/2 and Y = calc – obs. (equivalent to rotating the data by 45 deg clockwise) It’s the same data but the effect is then dramatic.
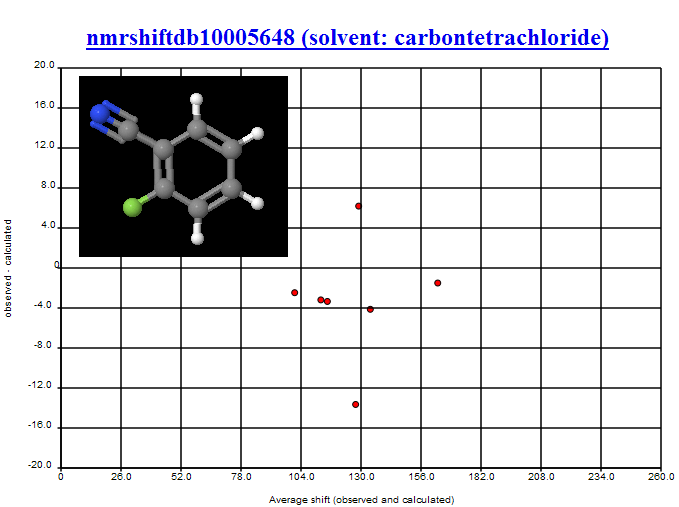
The misassignment is marked by two peaks at the same average value but displaced roughly equal amounts above and below the rest of the data. It’s also much clearer what the offset is – this data runs at approximately -3 +- 1 ppm – i.e. the precision seems to be very high.
The offset could be due to errors in reporting the shift, errors in using/calculating TMS (if it was used to calibrate) or other absolute errors in the GIAO method. But it’s clear that within a particular sample assignments can be validated to limits of 1-2 ppm. That’s good news if it’s universal.
-
Recent Posts
-
Recent Comments
- pm286 on ContentMine at IFLA2017: The future of Libraries and Scholarly Communications
- Hiperterminal on ContentMine at IFLA2017: The future of Libraries and Scholarly Communications
- Next steps for Text & Data Mining | Unlocking Research on Text and Data Mining: Overview
- Publishers prioritize “self-plagiarism” detection over allowing new discoveries | Alex Holcombe's blog on Text and Data Mining: Overview
- Kytriya on Let’s get rid of CC-NC and CC-ND NOW! It really matters
-
Archives
- June 2018
- April 2018
- September 2017
- August 2017
- July 2017
- November 2016
- July 2016
- May 2016
- April 2016
- December 2015
- November 2015
- September 2015
- May 2015
- April 2015
- January 2015
- December 2014
- November 2014
- September 2014
- August 2014
- July 2014
- June 2014
- May 2014
- April 2014
- March 2014
- February 2014
- January 2014
- December 2013
- November 2013
- October 2013
- September 2013
- August 2013
- July 2013
- May 2013
- April 2013
- March 2013
- February 2013
- January 2013
- December 2012
- November 2012
- October 2012
- September 2012
- August 2012
- July 2012
- June 2012
- May 2012
- April 2012
- March 2012
- February 2012
- January 2012
- December 2011
- November 2011
- October 2011
- September 2011
- August 2011
- July 2011
- May 2011
- April 2011
- March 2011
- February 2011
- January 2011
- December 2010
- November 2010
- October 2010
- September 2010
- August 2010
- July 2010
- June 2010
- May 2010
- April 2010
- August 2009
- July 2009
- June 2009
- May 2009
- April 2009
- March 2009
- August 2008
- July 2008
- June 2008
- May 2008
- April 2008
- March 2008
- February 2008
- January 2008
- December 2007
- November 2007
- October 2007
- September 2007
- August 2007
- July 2007
- June 2007
- May 2007
- April 2007
- December 2006
- November 2006
- October 2006
- September 2006
-
Categories
- "virtual communities"
- ahm2007
- berlin5
- blueobelisk
- chemistry
- crystaleye
- cyberscience
- data
- etd2007
- fun
- general
- idcc3
- jisc-theorem
- mkm2007
- nmr
- open issues
- open notebook science
- oscar
- programming for scientists
- publishing
- puzzles
- repositories
- scifoo
- semanticWeb
- theses
- Uncategorized
- www2007
- XML
- xtech2007
-
Meta
The nice thing about this plot, is that it is much easier to see which atom-shift assignments are mixed up: they are no longer on y=-x, but on some vertical line. The y=-x works too, but is less clear when the x and y unit vector lengths are not identical.