I’m now returning to UK for a few weeks before coming back to AU to continue. This is a longish post but important for anyone wanting to know the details of how we build an intelligent PDF reader and what it will be able to do. Although the examples are chemistry-flavoured the approach applies to a wide range of science.
To recall…
AMI2 is a project to build an intelligent reader of the STM literature. The base is PDF documents (though Word, HTML and LaTeX will also be possible and much easier and of higher quality). There are three phases at present (though this and the names may change):
- PDF2SVG. This converts good PDF losslessly into SVG characters, path and images. It works well for (say) student theses and ArXiV submissions but fails for most STM publisher PDFs because the quality of the “typesetting ” is non-conformant and we have to use clunky, fragile heuristics. More on later blogs and below.
- SVGPLUS. This turns low-level SVG primitives (characters and paths) into higher level a-scientific objects such as paragraphs, sections, word, subscripts, rectangles, polylines, circles, etc. In addition it analyses components that are found universally in science (figures, tables, maths equations) and scientific document structure. It also identifies graphs, plots, etc. (but not chemistry, sequences, trees…)
- SVG2XML. This interprets SVGPLUS output as science. At present we have prototyped chemistry, phylogenetics, spectroscopy and have a plugin architecture that others can build on. The use of SVG primitives makes this architecture much simpler.
We’ve written a report and here are salient bits. It’s longish so mainly for those interested in the details. But it has a few pictures…
PDFs and their interpretation by PDF2SVG
Science is universally published as PDF documents, usually created by machine and human transformation of Word or LaTeX documents. Almost all major publishers regard “the PDF” as the primary product (version of record) and most scientists read and copy PDFs directly from the publishers’ web sites; the technology is independent of whether this is Open or closed access. Most scientists read, print and store large numbers of PDFs locally to support their research.
PDF was designed for humans to read and print, not for semantic use. It is primarily “electronic paper” – all that can be guaranteed is coloured marks on “e-paper”. It was originally proprietary and has only fairly recently become an ISO standard. Much of the existing technology is proprietary and undocumented. By default, therefore a PDF only conveys information to a sighted human who understands the human semantics of the marks-on-paper.
Over 2 million scholarly publications are published each year, most only easily available in PDF. The scientific information in them is largely lost without an expert human reader, who often has to transcribe the information manually (taking huge time and effort). Some examples:
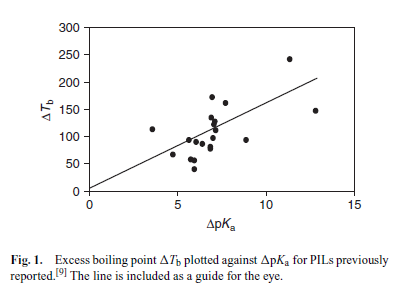
In a PDF these are essentially black dots on paper. We must develop methods to:
- PDF2SVG: Identify the primitives (in this case characters, and symbols). This should be fairly easy but because the technical standard of STM publishing is universally very non-conformant to standards (i.e. “poor”) we have had to create a large number of arbitrary rules. This non-conformity is a major technical problem and would be largely removed by the use of UTF-8 and Unicode standards.
- . SVGPLUS (and below): Understand the words (e.g. that “F”-“I”-“g” and “E”-“x”-“c”-“e”-“s”-“s” are words). PDF has no concept of “word”, “sentence”, “paragraph”, etc.
- Detect that this is a Figure (e.g. by interpreting “Fig. “)
- Separate the caption from the plot
- Determine the axial information (labels, numbers and tics and interpret (or here guess) units
- Extracts the coordinates of points (black circles)
- Extract the coordinates of the line
If the PDF is standards-compliant it is straightforward to create the SVG. We use the Open Source PDFBox from Apache to “draw” to a virtual graphics device. We intercept these graphics calls and extract information on:
- Position and orientation. PDF objects have x,y coordinates and can be indefinitely grouped (including scaling). PDF resolves all of this into a document on a virtual A4 page (or whatever else is used). The objects also have style attributes (stroke and fill colours, stroke-widths , etc.). Most scientific authors use simple colours and clean lines which makes the analysis easier.
-
Text (characters). Almost all text is individual characters which can be in any order (“The” might be rendered in the order “e”-“h”-“T”. Words are created knowing the screen positions of their characters. In principle all scientific text (mathematical equations, chemical symbols, etc.) can be provided in the Unicode toolset (e.g. a reversible chemical reaction symbol

is the Unicode point U+21CC or html entity ⇌ and will render as such in all modern browsers.
-
Images. These are bitmaps (normally rectangular arrays of pixels) and can be transported as PNG, GIF, JPEG, TIFF, etc. There are cases (e.g. photographs of people or scientific objects) where bitmaps are unavoidable. However some publishers and authors encode semantic information as bitmaps, thereby destroying it. Here is an example:
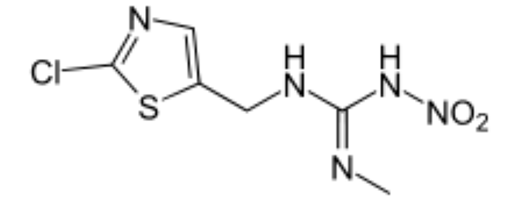
Notice how the lines are fuzzy (although the author drew them cleanly). It is MUCH harder to interpret such a diagram than if it had been encoded as characters and lines. Interpretation of bitmaps is highly domain-dependent and usually very difficult or impossible. Here is another (JPEG)

Note the fuzziness which is solely created by the JPEG (lossy) compression. Many OCR tools will fail on such poor quality material
-
Path (graphics primitives). These are used for objects such as
- graphical plots (x-y, scatterplots, bar charts)
-
chemical structures
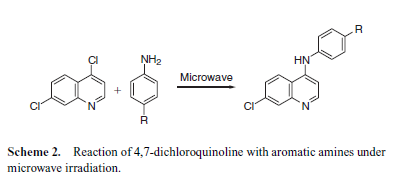
This scheme, if drawn with clean lines, is completely interpretable by our software as chemical objects
- diagrams of apparatus
- flowcharts and other diagrams expressing relationships
Paths define only Move, Line, Curve. To detect a rectangle SVGPLUS has to interpret these commands (e.g. MLLLL).
There are, unfortunately, a large occurrence of errors and uncertainties. The most common is the use of non-standard, non-documented encodings for characters. These come from proprietary tools (such as Font providers of TeX, etc,) and from contracted typesetters. In these cases we have to cascade down:
- Guess the encoding (often Unicode-like)
- Create a per-font mapping of names to Unicode. Thus “MathematicalPi-One” is a commonly used tool for math symbols: its “H11001” is drawn as a PLUS and we translate to Unicode U+002B but there is no public (or private) translation table (We’ve asked widely). So we have to do this manually by comparing glyphs (the printed symbol) to tables of Unicode glyphs. There are about 20 different “de facto” fonts and symbol sets in wide scientific use and we have to map them manually (maybe while watching boring cricket on TV). We have probably done about 60% of what is required
- Deconstruct the glyphs. Ultimately the PDF provides the graphical representation of a glyph on the screen, either as vectors or as a bitmap. We recently discovered a service (shapecatcher) which interprets up to 11,000 Unicode glyphs and is a great help. Murray Jensen has also written a glyph browser which cuts down the human time very considerably.
-
Apply heuristics. Sometimes authors or typesetters use the wrong glyph or kludge it visually. Here’s an example:

Most readers would read as “ten-to-the-minus-seven” but the characters are actually “1”, “0”, EM-DASH, “7”. EM-DASH – which is used to separate clauses like this – is not a mathematical sign so it’s seriously WRONG to use it. We have to add heuristics (a la UNIX lint) to detect and possibly correct. Here’s worse. There’s a perfectly good Unicode symbol for NOT-EQUALS (U+2260)

Unfortunately some typsetters will superimpose an EQUALS SIGN (=)with a SLASH (/). This is barbaric and hard and tedious to detect and resolve. The continued development of PDF2SVG and SVGPLUS will probably be largely hacks of this sort.
SVG and reconstruction to semantic documents SVGPLUS
SVGPLUS assumes a correct SVG input of Unicode characters, SVG Paths, and SVGImages (the latter it renders faithfully and leaves alone). The task is driven by a control file in a declarative command language expressed in XML. We have found this to be the best method of representing the control, while preserving flexibility. It has the advantage of being easily customisable by users and because it is semantic can be searched or manipulated. A simple example:
<semanticDocument xmlns=”http://www.xml-cml.org/schema/ami2″>
<documentIterator filename=”org/xmlcml/svgplus/action/ “>
<pageIterator>
<variable name=”p.root” value=”${d.outputDir}/whitespace_${p.page}” type=”file”/>
<whitespaceChunker depth=”3″ />
<boxDrawer xpath=”//svg:g[@LEAF=’3′]” stroke=”red” strokeWidth=”1″ fill=”#yellow” opacity=”0.2″ />
<pageWriter filename=”${p.root}_end.svg” />
</pageIterator>
</documentIterator>
</semanticDocument>
This document identifies the directory to use for the PDFs (“action”), iterates over each PDF it finds, creates (SVG) pages for each, processes each of those with a whitespaceChunker (v.i.) and draws boxes round the result and writes each page to file. (There are many more components in SVGPLUS for analysing figures, etc). A typical example is:
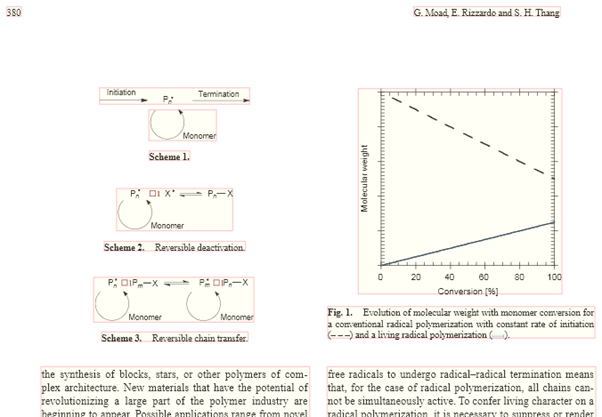
SVGPLUS has detected the whitespace-separated chunks and drawn boxes round the “chunks”. This is the start of the semantic document analysis. This follows a scheme:
- Detect text chunks and detect the font sizes.
-
Sort into lines by Y coordinate and sort within lines by X coordinate. The following has 5 / 6 lines:


Normal, superscript, normal, subscript (subscript), normal
- Find the spaces (PDF often has no explicit space characters – the spaces have to be calculated by intercharacter distance. This is not standard and is affected by justification and kerning.
- Interpret variable font-size as sub- and super-scripts.
- Manage super-characters such as the SIGMA.
-
Join lines. In general one line can be joined to the next by adding a space. Hyphens are left as their interpretation depends on humans and culture. The output would thus be something like:
the synthesis of blocks, stars, or other polymers of com~plex architecture. New materials that have the potential of revolutionizing a large part …
This is the first place at which words appear.
- Create paragraphs. This is through indentation heuristics and trailing characters (e.g. FULL STOP).
-
Create sections and subsections. This is normally through bold headings and additional whitespace. Example:
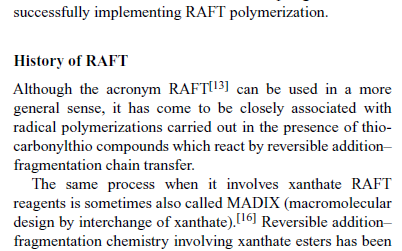
Here the semantics are a section (History of RAFT) containing two paragraphs
The PATH interpretation is equally complex and heuristic. In the example below:

The reversible reaction is made up of two ML paths (“lines”) and two filled curves (“arrowheads”). All this has to be heuristically determined. The arcs are simple CURVE-paths. (Note the blank squares are non-Unicode points)
In the axes of the plot
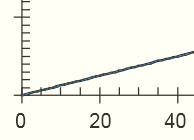
All the tick-marks are independent paths – SVGPLUS has to infer heuristically that it is an axis.
In some diagrams there is significant text:
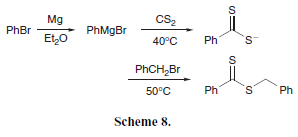
Here text and graphical primitives are mixed and have to be separated and analysed.
In summary SVVGPLUS consists of a large number of heuristics which will reconstruct a large proportion (but not all) scientific articles into semantic documents. The semantic s do and will include:
- Overall sectioning (bibliographic metadata, introduction, discussion, experimental, references/citations
- Identification and extraction of discrete Tables, Figures, Schemes
- Inline bibliographic references (e.g. superscripted)
- Reconstruction of tables into column-based object(where possible)
- Reconstruction of figures into caption and graphics
- Possible interpretation of certain common abstract scientific graphical objects (graphs, bar charts)
- Identification of chemical formulae and equations
- Identification of mathematical equations
There will be no scientific interpretation of these objects
Domain specific scientific interpretation of semantic documents
This is being developed as a plugin-architecture for SVGPLUS. The intention is that a community develops pragmatics and heuristics for interpreting specific chunks of the document in a domain specific manner. We and our collaborators will develop plugins for translating documents into CML/RDF:
- Chemical formulae and reaction schemes
- Chemical synthetic procedures
- Spectra (especially NMR and IR)
- Crystallography
- Graphical plots of properties (e.g. variation with temperature, pressure, field, molar mass, etc.)
More generally we expect our collaborators (e.g. Ross Mounce, Panton Fellow, paleophylogenetics at University of Bath UK) to develop:
- Mathematical equations (into MathML).
- Phylogenetic trees (into NEXML)
- NA and protein sequences into standard formats
- Dose-response curves
- Box-plots
Fidelity of SVG rendering in PDF2SVG. This includes one of the very rare bugs we cannot solve:
PDF:

SVG
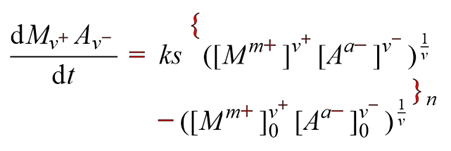
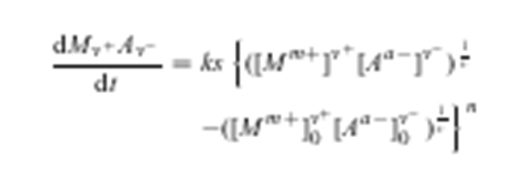
[Note that the equations are identical apart from the braces which are mispositioned and too small. There is no indication in TextPosition as to where this scaling comes from.
In PDFReader the equation is correctly displayed (the text is very small so the screenshot is blurry. Nonetheless it’s possible to see that the brackets are correct)
Pingback: Unilever Centre for Molecular Informatics, Cambridge - Topics and Links for my talk on Semantic Web for Materials « petermr's blog