Next Tuesday I am giving an invited talk at Oxford on Open Data http://digital-research.oerc.ox.ac.uk/ , http://digital-research.oerc.ox.ac.uk/programme , and also involved with a session run by the OKF immediately afterwards. As always I don’t know what I am going to say until 0200 of the morning of the talk – this gives a chance to talk with delegates and get a feel for what is valuable.
I’ll touch on at least the following:
- The Long Tail. Scientific disciplines which have little formal information infrastructure but huge amounts of science. Disciplines such as bioscience (outside mainstream bioinformatics-support, such as phylogenetics), chemistry. Materials science, observational sciences (other than astronomy), much computational and simulation research. Much of the data is valuable but thrown away. I estimate billions (sic) of dollars is wasted through non-existent infrastructure
- Graduate Students. A seriously misused resource. Much of the innovation comes from third-year postgraduates and we need to give them expression
- Software/informatics as a first-class activity. Builders of scientific software are often denigrated as not “doing proper science”, but they are every bit as important as the scientists who build telescopes and other instruments.
- Bottom-up communities. There is a huge cognitive/informatics surplus if we treat the citizen community as equals and not inferiors. (Much of the software we work with is developed outside “research universities”. We should be helping this grow.
- Liberation software. I and others are building software which will free data in dark silos, repositories, theses, journals, etc. I’ll present some of this in the afternoon briefly. The main battle we face is closed minds and vested interests; liberation software will leapfrog many of these.
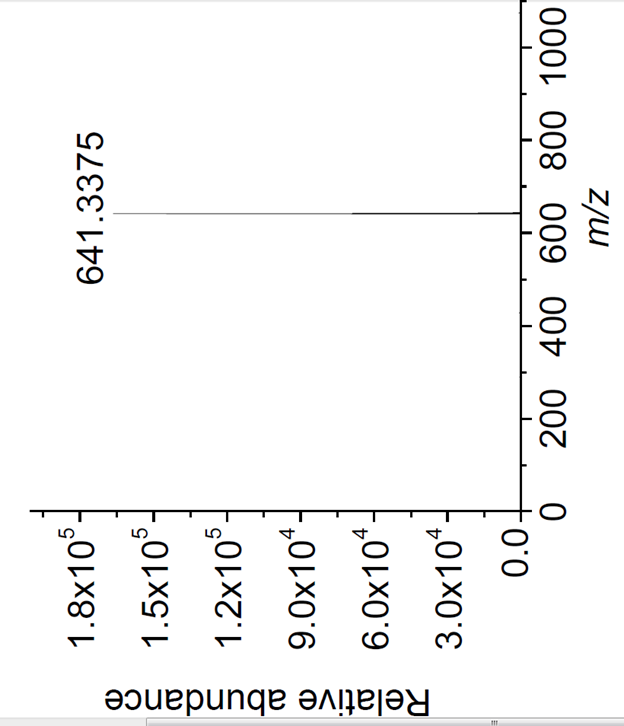
I’ll be showing some of this in action, but here’s a taster. It comes from the supplemental information in a paper behind a publisher’s firewall. I don’t know if I am allowed to show it, but I’ll take the chance. It’s a mass spectrum – in simple terms it measures the mass of a molecule (here to 4 sig figures). Here are some questions. (Please add answers as comments because then I know people are interested and also I might learn something). [BTW this is how it appears in the paper – I assume the journal prints text upside down to make it easy for Australians, but I have to hang from the ceiling to read this.
UPDATE: Walter Blackstock has given some answers and I reply
Questions (in order of difficulty):
- What’s the constitutional formula of the compound? (relatively easy for chemists)
- How many peaks are there? (harder than it looks)
- How would you find where this diagram was published? (very hard)
On Tuesday I will show how Liberation Software AMI2 can be used to answer Q 3.
1. I doubt there is a unique composition for what I assume to be a protonated singly charged molecular ion, assuming it to contain CHN and O. It’s a peculiarly ‘clean’ spectrum, so maybe a pure compound.
2. I can just about see the isotope peaks. One would normally look at the mass listing, or expand the region if that information were needed. (The C-13 contribution constrains the number of carbon atoms in the empirical formula. The isotope cluster would also tell you the charge state and if sulphur is present.)
3. No idea about the journal, but in fairness I can’t see why I’d want to know if all I had was that figure. It’s not a particularly information rich spectrum. The rotation through 90 deg. is atypical and abundance axis is odd: I’d say the counts are absolute not relative and the 0.0 looks out of place.
The deposition of mass spectrometry raw data is now mandatory for the major mass spectrometry journals. This can be 100 GB or more for some biological studies. Whether the tools to process the data are accessible is another discussion! I’d note that there is a very detailed recent literature on the integrity and interpretation of MS data.
Many thanks indeed Walter! Extremely insightful and helpful.
>>1. I doubt there is a unique composition for what I assume to be a protonated singly charged molecular ion, assuming it to contain CHN and O. It’s a peculiarly ‘clean’ spectrum, so maybe a pure compound.
It is indeed C,H,N,O only. It’s the result of a chemical synthesis. I assume it is fairly pure
>>2. I can just about see the isotope peaks.
And this is part of the point. The peaks are there and I can extract them from the diagram even though their separation is less than the graphics line width.
>>One would normally look at the mass listing, or expand the region if that information were needed. (The C-13 contribution constrains the number of carbon atoms in the empirical formula. The isotope cluster would also tell you the charge state and if sulphur is present.)
Indeed and I can do this (at least for a limited amount). I’d guess we could get a reasonable constraint for the number of carbons
>>3. No idea about the journal, but in fairness I can’t see why I’d want to know if all I had was that figure.
Yes – I have been naughty. It’s supplemental info and I would guess therefore journal-independent – i.e. author dependent. There are about 30 compounds all with 3 pages (HNMR, CNMR, and MS+IR). They all have structural diagrams and names (which is why I chopped those out)
>> It’s not a particularly information rich spectrum. The rotation through 90 deg. is atypical and abundance axis is odd: I’d say the counts are absolute not relative and the 0.0 looks out of place.
Yes. The rotation is because the whole page is landscape (very common) so y-axes are upside down.
>> The deposition of mass spectrometry raw data is now mandatory for the major mass spectrometry journals. This can be 100 GB or more for some biological studies. Whether the tools to process the data are accessible is another discussion! I’d note that there is a very detailed recent literature on the integrity and interpretation of MS data.
Yes – the proteomics community has done a good job here.
My main point is that this is not a C21 way of providing data and that there is no technical reason why the data per se should not be provided. Also to show that PDFs destroy information. Most people would not realise there were overlapping peaks. In other cases (e.g. phylogenetic trees) we get zero-length lines which can carry useful info.
Pingback: A World of Digital Openness: Panton in September | The Stilettoed Mathematician