When making claims in foo-metrics and foo-informatics it is essential to have access to the data and the algorithms used. That’s why, for example, Peter Corbett and Sciborg colleagues are so careful in constructing their corpus. In developing our Open Notebook NMR we have to do the same for our data. As I have explained earlier, variance can come from many sources and all must be examined. So here is the first pass at our raw data – a histogram of the (absolute) internal RMS within a structure, fitted to
y = x + c + eps
where x has units of 13C ppm.
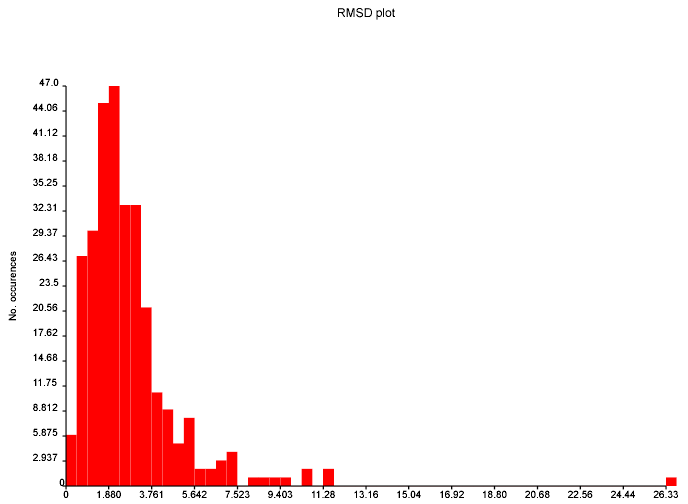
It’s obvious that we should throw away the outlier isn’t it?
But we cannot – absolutely must not – unless we have good reason to do so. Until then it contributes to the variance.
-
Recent Posts
-
Recent Comments
- pm286 on ContentMine at IFLA2017: The future of Libraries and Scholarly Communications
- Hiperterminal on ContentMine at IFLA2017: The future of Libraries and Scholarly Communications
- Next steps for Text & Data Mining | Unlocking Research on Text and Data Mining: Overview
- Publishers prioritize “self-plagiarism” detection over allowing new discoveries | Alex Holcombe's blog on Text and Data Mining: Overview
- Kytriya on Let’s get rid of CC-NC and CC-ND NOW! It really matters
-
Archives
- June 2018
- April 2018
- September 2017
- August 2017
- July 2017
- November 2016
- July 2016
- May 2016
- April 2016
- December 2015
- November 2015
- September 2015
- May 2015
- April 2015
- January 2015
- December 2014
- November 2014
- September 2014
- August 2014
- July 2014
- June 2014
- May 2014
- April 2014
- March 2014
- February 2014
- January 2014
- December 2013
- November 2013
- October 2013
- September 2013
- August 2013
- July 2013
- May 2013
- April 2013
- March 2013
- February 2013
- January 2013
- December 2012
- November 2012
- October 2012
- September 2012
- August 2012
- July 2012
- June 2012
- May 2012
- April 2012
- March 2012
- February 2012
- January 2012
- December 2011
- November 2011
- October 2011
- September 2011
- August 2011
- July 2011
- May 2011
- April 2011
- March 2011
- February 2011
- January 2011
- December 2010
- November 2010
- October 2010
- September 2010
- August 2010
- July 2010
- June 2010
- May 2010
- April 2010
- August 2009
- July 2009
- June 2009
- May 2009
- April 2009
- March 2009
- August 2008
- July 2008
- June 2008
- May 2008
- April 2008
- March 2008
- February 2008
- January 2008
- December 2007
- November 2007
- October 2007
- September 2007
- August 2007
- July 2007
- June 2007
- May 2007
- April 2007
- December 2006
- November 2006
- October 2006
- September 2006
-
Categories
- "virtual communities"
- ahm2007
- berlin5
- blueobelisk
- chemistry
- crystaleye
- cyberscience
- data
- etd2007
- fun
- general
- idcc3
- jisc-theorem
- mkm2007
- nmr
- open issues
- open notebook science
- oscar
- programming for scientists
- publishing
- puzzles
- repositories
- scifoo
- semanticWeb
- theses
- Uncategorized
- www2007
- XML
- xtech2007
-
Meta
The mean and variance assume a normal distribution and are sensitive to outliers. You should use the median and the inter-quartile range. This isn’t a fudge-factor – the values of the mean and variance are misleading when looking at non-normal distributions.
Also, why are you plotting the absolute value rather than the actual value? You are throwing away interesting information by folding +ve and -ve values on top of each other.
This diagram is per structure. Unless you suspect that particular structures have systematic errors, you should also do one per predicted shift. Presumably, particular environments of C atom are more difficult to calculate than others…?