Last week I showed how we can automatically extract data from images. The example was a phylogenetic tree, and although lots of people think these are wonderful, even more will have switched off. So now I’m going to show how we can analyse a “graph” and extract a CSV file. This will be in instalments so that you will be left on a daily cliff-edge… (actually it’s because I am still refining and testing the code). I am taking the example from “Acoustic Telemetry Validates a Citizen Science Approach for Monitoring Sharks on Coral Reefs” (http://www.plosone.org/article/info%3Adoi%2F10.1371%2Fjournal.pone.0095565) [I’ve not read it, but I assume they got volunteers to see how long they could evade being eaten with and without the control).
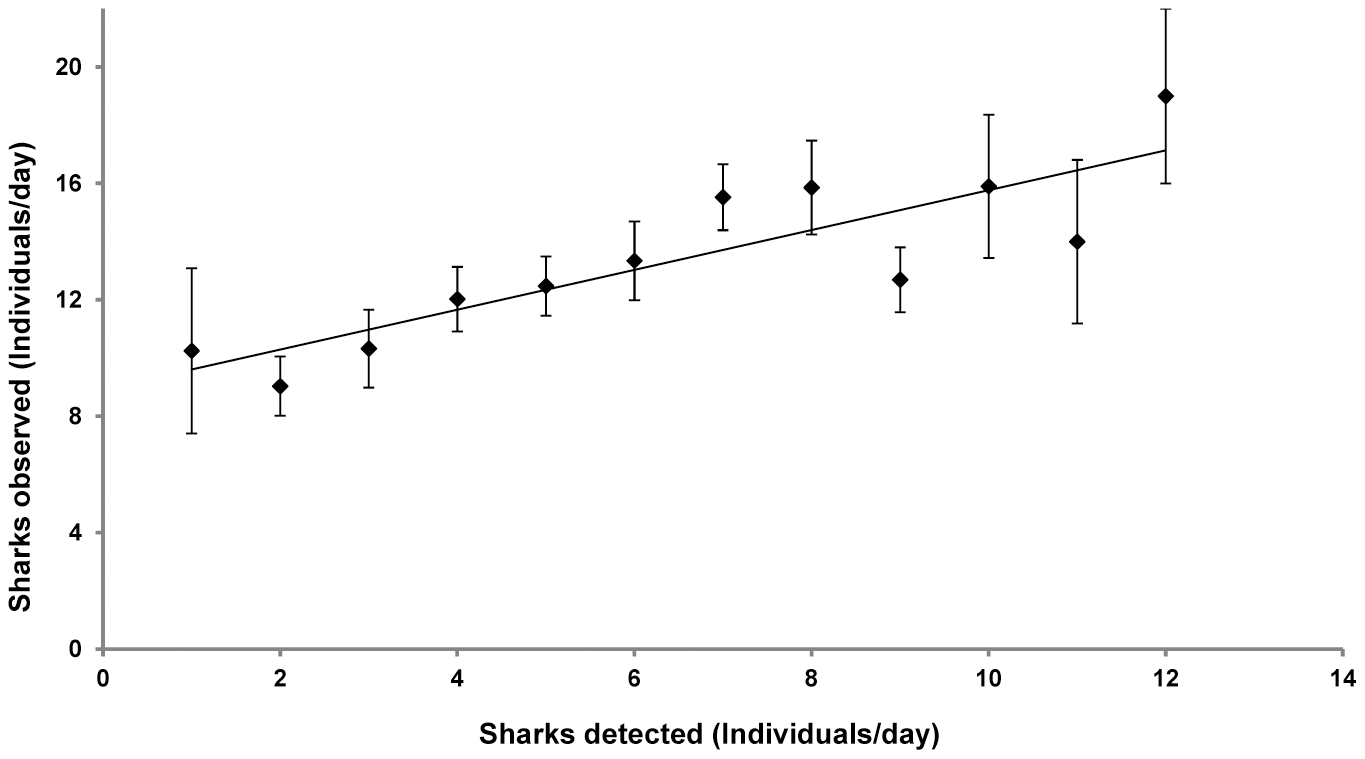
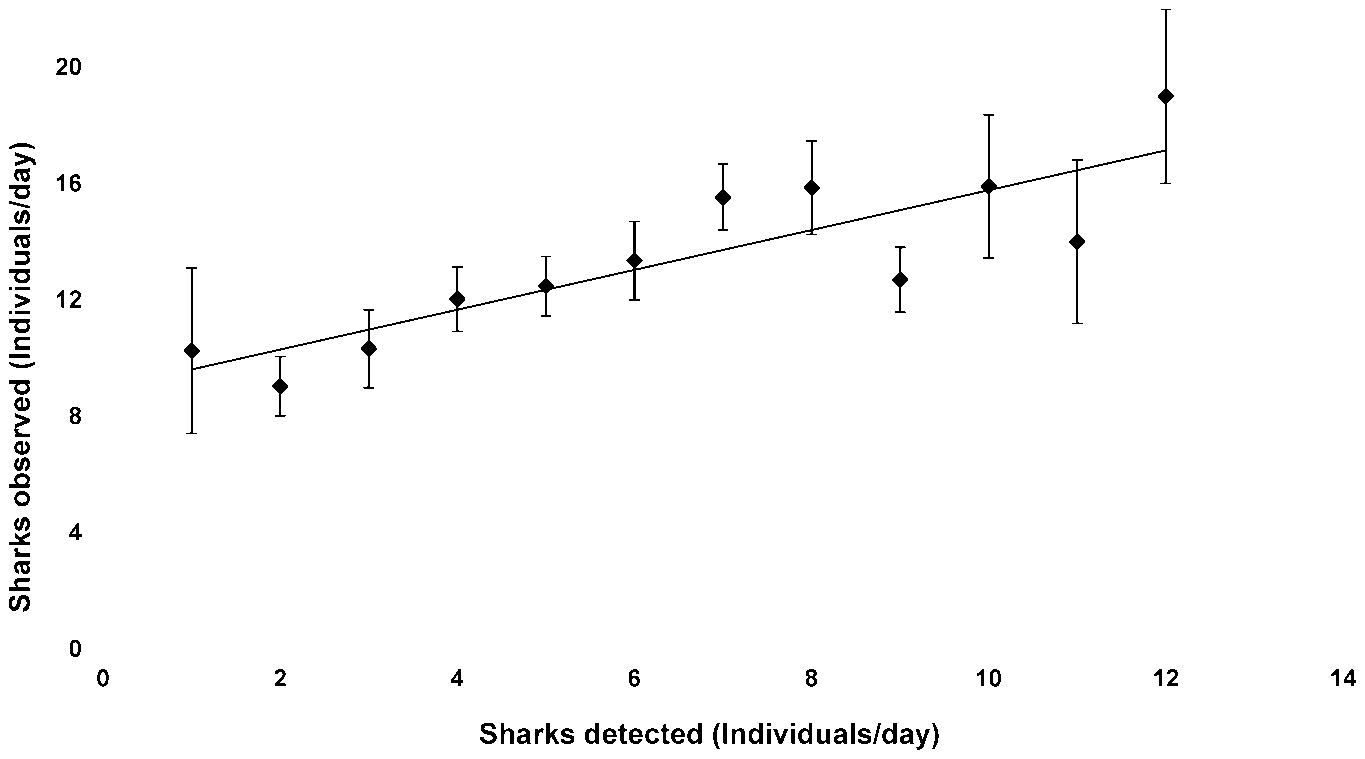
Anyway here’s our graph. I think most people can understand it. There’s:
- an x-axis, with ticks, numbers (0-14), title (“Sharks detected”) and units (“Individuals/day”)
- a y-axis, with ticks, numbers (0-20), title (“Sharks observed”) and units (“Individuals/day”)
- 12 points (black diamonds)
- 12 error bars (like Tie-fighters) appearing to be symmetric
- one “best line” through the points
We’d like to capture this as CSV. If you want to sing along, follow: http://www.bitbucket.org/petermr/diagramanalyzer/org.xmlcml.diagrams.plot.PlotTest (the link will point to a static version – i.e. not updated as I add code).
This may look simple, but let’s magnify it:

Whatever has happened? The problem is that we have a finite number of pixels. We might paint them black (0) or white (255) but this gives a jaggy effect which humans don’t like. So the plotting software adds gray pixels to fool your eye. It’s called antialiasing (not a word I would have thought of). So this means the image is actually gray.
Interpreting a gray scale of images is tough, and most algorithms can only count up to 1 (binary) so we “binarize” the image. That means that pixel becomes either 0 (black) or 1 (white). This has the advantage that the file/memory can much smaller and also that we can do toplogical analyses as in the last blog post. But it throws information away and if we are looking at (say) small characters this can be problematic. However it’s a standard first step for many people and we’ll take it.
The simplest way to binarize a gray scale (which goes from 0 to 255 in unit steps) is to classify 0-127 as “black” and 128-255 as “white”. So let’s do that:
Now if we zoom in we can see the pixels are binary:

So this is the next step on our journey – how are we going to turn this into a CSV file? Not quite as simple as I have made it out – keep your brain in gear…
I’ll leave you on the cliff edge…
Pingback: Content Mining: Extraction of data from Images into CSV files – step 0 – ContentMine