I’m taking this opportunity to announce that we can now extract semantic physical science from the published scientific literature.
This means that scholarly publications become a giant distributed knowledgebase.
Here’s a very brief sketch…
Start with an OPEN ACCESS PDF: http://www.mdpi.com/1996-1944/5/1/27/pdf
YOU can read this. Go to page 6
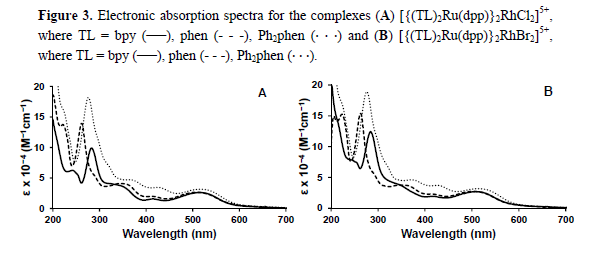
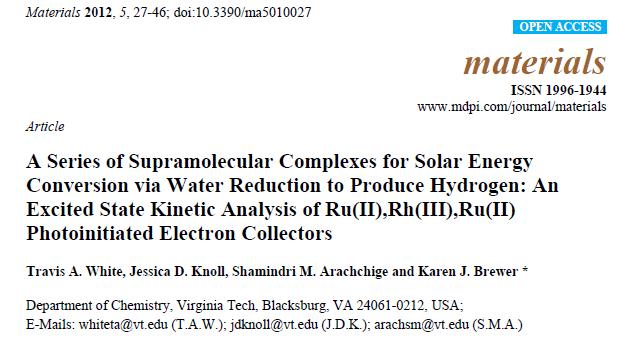
Could we compare the spectra for Cl and Br? Photocopy onto transparency and overlay?
AMI can now read DIRECTLY from the PDF. And translate into CML (Chemical Markup Language). She reads one page per second.
And creates CML… ON THE FLY
<?xml version=”1.0″ encoding=”UTF-8″?>
<cml xmlns=”http://www.xml-cml.org/schema”>
<spectrum convention=”JSpecView” type=”VIS”>
<spectrumData>
<xaxis multiplierToData=”1.0″>
<array dataType=”xsd:double” size=”621″>208.86 208.92 … 208.86</array>
</xaxis>
<yaxis multiplierToData=”1.0″ constantToData=”200.0″>
<array dataType=”xsd:double” size=”621″>61.38 61.74 … 61.38</array>
</yaxis>
</spectrumData>
</spectrum>
</cml>
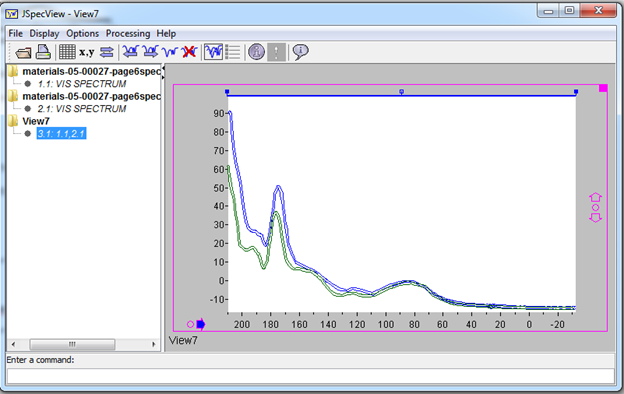
And JSpecview can display this!
We’ll work on MDPI content because it’s OPEN! (We can’t work on RSC, Nature, ACS, Elsevier because we will be sued).
But come October 2013 I’ll be back in UK and Hargreaves says it will be LEGAL to mine these sources for facts.
Like spectra.
Exciting times!
That’s impressive! Could you provide some details on the implementation and limitations?
I assume this works better on graphs included as PDF/PS than figures included as PNG. And it looks like the scales need to be adjusted manually, don’t they?
Implementation is in http://bitbucket.org/petermr/pdf2svg , ../pdf2svg1 and ../svgplus. Latter is still alpha.
It scans a page for whitespace and isolates chunks. Builds words etc from relative positions of characters
It’s not manual, it’s automatic but needs a lot of tuning.
Yes, it works on PS graphs ate present though I am developing algorithms for PNG and (arghh! JPEG).
Any community activity highly valued 🙂
Why are your y values in the CML around 60+, whereas on the chart you show they appear to be around 15? Automatic units conversion in AMI?
Well spotted!
The scales *do* work in V 0.1 but this is V 0.2!
I pasted an old example. I should be able to fix this in the next day or two.