Peter Sefton at USQ has developed the ICE system – a carefully thought out and engineered system for authoring compound documents in a scholarly environment based largely on XML. He has no illusions about the difficulty of this and the appalling state of current software. I’m visiting Peter next month and in my usual optimistic fashion think that we can create a proof of concept for chemistry in a day or so. (Peter has already shown this is possible). In his latest post he shows how you can create interactive maps. Read Peter’s original post as it works very nicely (but doesn’t paste directly into my blog)
ICE Mashups, part one, take two
[…]
First up, I invite you to admire this map which shows the route of a bike ride I went on with the Toowoomba Bicycle Users Group.
[… map snipped as it crashed WordPress editing …]
And if you click on the title at the top (open it in a new window) it will take you to Bikely where you can look at the ups and downs of riding on the Darling Downs by clicking onShowthenElevation profile.
[… snipped …]
(Note: I think there’s something wrong; it shows a very dramatic dip in the ride that I don’t remember, around the 26km mark).
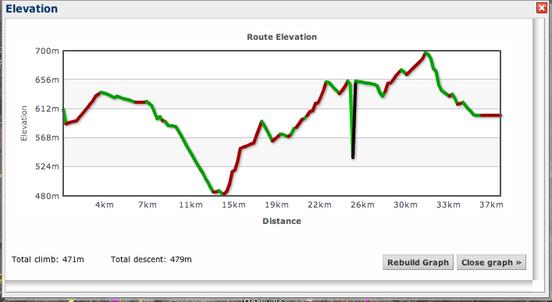
PMR: (The graph has been automatically created from Peter’s GPS system and part of the post is about how to get the data easily into ICE).
My interest is in having interactive graphs. We have been doing this so far with SVG but it’s a lot of labour and really out to be a solved problem already. Graphs are so important. How many times do you want to calculate something from a graph? For example in the current case it’s natural to ask what is the gradient of the steep drop? Looks to be about 100 m drop in 100 m horizontal. That’s beyond the range of the average Pommie, although I suspect is so trivial in Oz they don’t even recall such minor dips. Maybe swinging on a Tarzan rope would do it.
XY graphs are so common and so important that we ought to be able to cut and paste them, preserving he semantics of the underlying data. One of my New Year WIBNIs.
For browser-based XY graphs, an interesting project to keep an eye on is Flot. Take a look at their examples for plots including interactive features, such as zooming and data selection.
(1) Thanks Dan – very nice. Will gently follow this
I assume that it’s not too difficult to add hyperlinks to points.
P.
Wow. Perhaps you *wouldn’t* remember a 400 ft fall? 😉
Pingback: PT’s blog » Blog Archive » Graphing with ICE