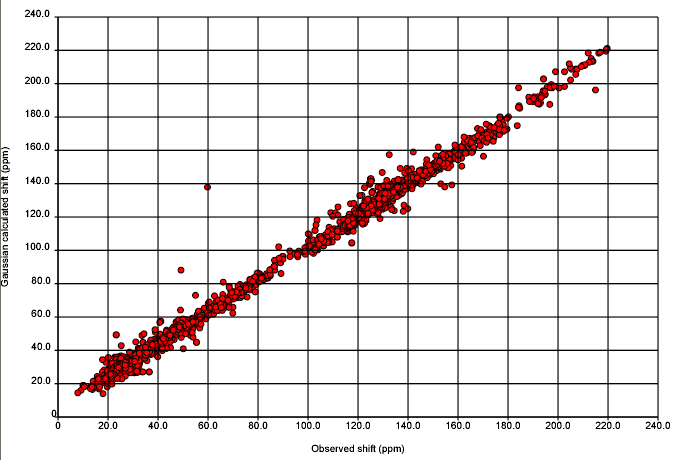
Antony guessed the graph – regular readers will recognise the context of previous posts. We are starting an Open Notebook project to determine whether theoretical calculations and experimental observations agree – or rather within what limits. (Earlier this year I talked with Michael Kohlhase about PhysML, where the basis of the language is to assert that observations and predictions do or do not agree and that hypotheses may or may not be disproved). Being a chemist my language may be sloppier – please forgive or correct me.
Anyway here it is. Nick Day has done all the work and deserves all the credit. There are ca 500 structures in this and they are all aggregated and plotted with the same origin.
Before analysing this, it’s important to know the methods in detail. Nick will post more.
Experimental: All (?) structures in NMRShiftDB were extracted (ca. 20000). Compounds unsuitable for calculation (e.g. with heavy metals) were excluded. All files were in CMLSpect and contained 3D coordinates (except for H atoms – everyone PLEASE include H atoms), 13C spectral peaks (shift in ppm), labelled with the atom or atoms to which they were assigned. The solvent, field strength(??), temperature (??) were recorded. I am not sure of the metadata (I am writing from home and Nick will fill all this in later).
In general there is no chance of re-running the spectrum or re-analysing the sample, but it may be possible to contact the authors on an occasional basis.
Calculation: We will give the basis set and method later (I don’t know whether Henry uses the term GIAO – he has extended the method). The calculation emits the isotropic tensor which is an absolute value (whereas the chemical shift is relative to tetramethyl silane).
I don’t know whether we should transform the experimental to be on the same scale as the calculated, but we have done the reverse. The calculated values are substracted from TMS (in the same solvent as reported for the spectrum).
The comparison is then plotted. We do, of course, have plots for each compound as well.
We’ll come onto the analysis later, but you may wish to think about possible reasons for disagreement (i.e. points lying off the line). I have over 10 reasons.
-
Recent Posts
-
Recent Comments
- pm286 on ContentMine at IFLA2017: The future of Libraries and Scholarly Communications
- Hiperterminal on ContentMine at IFLA2017: The future of Libraries and Scholarly Communications
- Next steps for Text & Data Mining | Unlocking Research on Text and Data Mining: Overview
- Publishers prioritize “self-plagiarism” detection over allowing new discoveries | Alex Holcombe's blog on Text and Data Mining: Overview
- Kytriya on Let’s get rid of CC-NC and CC-ND NOW! It really matters
-
Archives
- June 2018
- April 2018
- September 2017
- August 2017
- July 2017
- November 2016
- July 2016
- May 2016
- April 2016
- December 2015
- November 2015
- September 2015
- May 2015
- April 2015
- January 2015
- December 2014
- November 2014
- September 2014
- August 2014
- July 2014
- June 2014
- May 2014
- April 2014
- March 2014
- February 2014
- January 2014
- December 2013
- November 2013
- October 2013
- September 2013
- August 2013
- July 2013
- May 2013
- April 2013
- March 2013
- February 2013
- January 2013
- December 2012
- November 2012
- October 2012
- September 2012
- August 2012
- July 2012
- June 2012
- May 2012
- April 2012
- March 2012
- February 2012
- January 2012
- December 2011
- November 2011
- October 2011
- September 2011
- August 2011
- July 2011
- May 2011
- April 2011
- March 2011
- February 2011
- January 2011
- December 2010
- November 2010
- October 2010
- September 2010
- August 2010
- July 2010
- June 2010
- May 2010
- April 2010
- August 2009
- July 2009
- June 2009
- May 2009
- April 2009
- March 2009
- August 2008
- July 2008
- June 2008
- May 2008
- April 2008
- March 2008
- February 2008
- January 2008
- December 2007
- November 2007
- October 2007
- September 2007
- August 2007
- July 2007
- June 2007
- May 2007
- April 2007
- December 2006
- November 2006
- October 2006
- September 2006
-
Categories
- "virtual communities"
- ahm2007
- berlin5
- blueobelisk
- chemistry
- crystaleye
- cyberscience
- data
- etd2007
- fun
- general
- idcc3
- jisc-theorem
- mkm2007
- nmr
- open issues
- open notebook science
- oscar
- programming for scientists
- publishing
- puzzles
- repositories
- scifoo
- semanticWeb
- theses
- Uncategorized
- www2007
- XML
- xtech2007
-
Meta
When you say the values are relative to TMS, are you using the acutal raw spectra or are you trusting that the researcher is referencing in that way? This has always bothered me because I have seen experimental sections in journals referencing against CDCl3 as 77.0 ppm, while the shift of CDCl3 against TMS has been reported to be significantly different than that – for example 77.23 ppm:
http://www.chem.wisc.edu/areas/reich/Handouts/nmr/NMR-Solvents.htm
(1) Your are right to bring this up!
At present the experimental is simply as reported in NMRShiftDB and we’ll talk with Christoph tomorrow as to how much info is actually in there and how much is assumed. At present if a spectrum says the shift is 123.4 then we take it as 123.4. We adjust the calculated by the assumed value of TMS as calculated by Gaussian in the reported solvent.
More later.
I’ve seen the discrepancies Jean-Claude is talking about many times. However, a difference of 0.2ppm in C-13 is pretty much irrelevant. Admittedly since this is a referencing issue the 0.2ppm defect will be exhibited for every shift in the spectrum bit I judge this might be a small number of the molecules out of the entire dataset and the statistics of examining over 20000 molecules will swamp these small effects I believe. You’re unlikely to see these small differences relative to the larger errors of prediction. While it is possible to make corrections for solvent in some of the calculations shift differences of 0.2ppm can easily arise from temperature, concentration, concentration of water in solvent etc. also. It’s very difficult to account for this in a heterogeneous dataset generated in many labs by many people. There are many reasons for potential errors but among the most important are: 1) Structure as drawn is incorrect (can include specific tautomer issues, incorrect stereorepresentation for example, ). 2) Assignment as given is incorrect (number missed when entering, mutation of numbers (21.1 instead of 12.1) 3) Prediction fails on a particular structure, structure class 4) Software program scrambles numbers on molecule with numbering scheme of predicted shifts. 5) Solvent-dependent issues. 6) Aggregation issues based on concentration (micelles, aggregation phenomena etc).
Peter – FYI ACD/Labs are ready to participate in the work as discussed: http://www.chemspider.com/blog/?p=213#comment-3735
Peter and Tony,
I think this is a fantastic project and am very keen to see how accurate the QM techniques prove to be for the subset of structures that you choose from the NMRShiftDB, and then how helpful they can be in improving the accuracy of experimental shifts in this wonderful resource.
For the purposes of this work, we would be willing to provide the chemical shift predictions from the ACD/Labs software if you would like to use them in your comparison. If, for instance, they prove to be accurate enough to find many of these problems without the need for time consuming QM calculations, it may be preferrable to use the faster calculation algorithms that are available in our software. It may turn out that the ACD/Labs predictions could serve as a pre-filter to define which structures need the QM calculations and which don’t. Many variations on this theme come to mind, but we won’t know which are useful until we do the work.
Sincerely,
Brent Lefebvre
NMR Product Manager
Advanced Chemistry Development, Inc.