I took a snap poll of my colleagues. 2 knew it. One worked it out gradually. 2 did not know it. I think every human in education above the age of 10 should know it
I am writing an article for Nature on “Open Chemistry”. Here is the first paragraph of the first draft:
I am writing this article having just come back from the sixth annual UK All Hands meeting on [E-Science]. Several hundred delegates met to discuss how the Internet (and extensions such as the [Grid]) could support and change the way we do science. The message of one plenary lecture: “Digital Earth: The New Digital Commons” [1] by Timothy Foresman was starkly simple. Unless we act the higher organisms on the planet will die. This is not a conjecture; our data are sufficiently comprehensive and our simulation tools sufficiently good and cheap to make it a certain scientific fact. On the positive side, if we make every scrap of scientific research and knowledge fully public and develop and use collaborative tools across the planet we have a chance. The Internet may have come just in time.
Science is multidisciplinary. The [Keeling_curve] – the most beautiful and terrible graph of the twentieth century (Fig 1) links chemical bonding, spectroscopy, quantum mechanics, thermodynamics, fluid dynamics, meteorology, geology, astronomy, reactions, biochemistry, biology, oceanography, etc. directly to transport, economics, finance, politics, psychology and much more. It epitomises [eScience] which seeks to develop the tools, the content and the social science to support multidisciplinary collaborative science. How can we gather the data, formalize its representation, build the computational support, grow the community and share the results in forms that are appropriate to each reader? And who are the readers? Not just professional scientists, but children, senior citizens, lawmakers and funders in every country. And not only humans. To gather and manage this data and simulation we must make it accessible to machines since we cannot cope with the scale and complexity unaided.
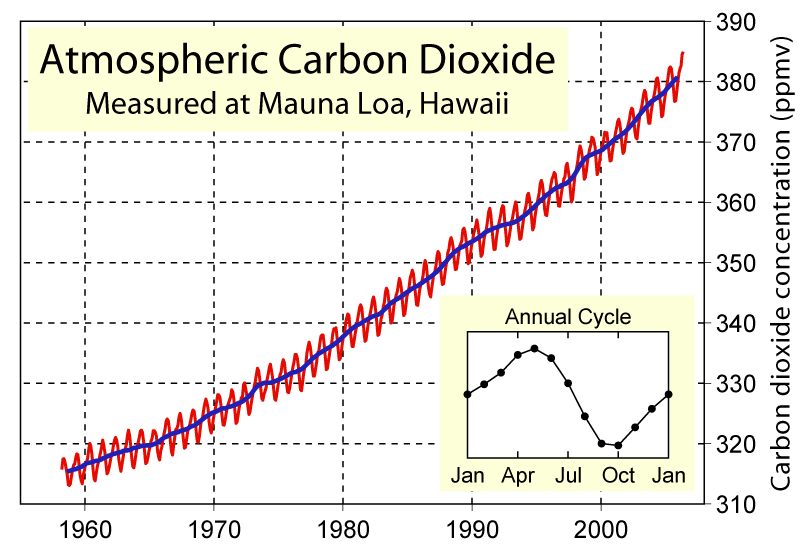
Figure 1. http://en.wikipedia.org/wiki/Keeling_curve
I shall talk about some of this at Berlin 5. Simply, Open Data might help save the planet. Any person or organization who fails to make data – of any sort – Open will have to answer to whatever comes after us.