The GIF (and its extended family of PNG, JPEG, TIFF, BMP, etc.) are major destroyers of scientific data. This post shows why they should be avoided for much scientific data. (The GIF has additional infamy through the patent fiasco). In this post I’ll us “GIF” to refer to all bitmapped formats (as opposed to vector formats such as SVG).
All bitmapped images contain data captured as individual pixels. The resolution of the data cannot, therefore be better than the separation between pixels. The problem occurs when a high-resolution object (such as a spectrum) is captured as a GIF. A spectrum in chemistry typically has a resolution along the x-axis of ca. 16, 000 points, while a GIF may have 1000, Therefore 94% of the data are lost in coverting from spectrum to GIF. Sometimes the conversion involves dithering pixels so that the final image looks somewhat more beautiful but this adds no information and usually destroys some. Anyway, here goes:
Text and chemicals:
– a bit diificult to read, so let’s magnify it:
Bigger but not much better…
… now we see the full horror – the dithering hasn’t added information – it just hid the problem.
It isn’t just that we have jaggies, but we can actually lose information in a seriously misleading manner. Here’s a chemical reaction:
This looks very pretty. But suppose we have to shrink it just a little bit (say 10%). Now we get:
What’s happened? The lines used to be one pixel wide. When the picture was shrunk the converter had to decide whether the line was in a vertical line of pixels. It just missed, so it’s not been drawn. This corrupts, rather than destroys the chemistry – it could be mistaken for a different molecule!
In practice the greatest destruction is probably in the spectra. Remember they have a resolution far greater than the screen. But here are some pixel-based spectra from supplemental data. You can find these in all publishers’ repositories…

The resolution of the spectrometer is probably 0.001 in the vertical axis – the GIF can only manage about .025
Here the spectrum has been dithered but that can’t save it. Again the actual data resolution is probably 50 times what you can see.
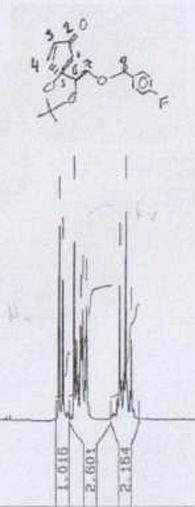
And this is one of the best. It was a proper digital spectrum. It’s been printed out (losing some of the metadata such as frequency), been annotated with the compound on a Post-it (though we cannot make sense of what is attached – it seems to be related to a different spectrum). Then it has been photcopied – losing resolution again. We don’t know how it got to the publisher, but here is their record of the scientific experiment.
-
Recent Posts
-
Recent Comments
- pm286 on ContentMine at IFLA2017: The future of Libraries and Scholarly Communications
- Hiperterminal on ContentMine at IFLA2017: The future of Libraries and Scholarly Communications
- Next steps for Text & Data Mining | Unlocking Research on Text and Data Mining: Overview
- Publishers prioritize “self-plagiarism” detection over allowing new discoveries | Alex Holcombe's blog on Text and Data Mining: Overview
- Kytriya on Let’s get rid of CC-NC and CC-ND NOW! It really matters
-
Archives
- June 2018
- April 2018
- September 2017
- August 2017
- July 2017
- November 2016
- July 2016
- May 2016
- April 2016
- December 2015
- November 2015
- September 2015
- May 2015
- April 2015
- January 2015
- December 2014
- November 2014
- September 2014
- August 2014
- July 2014
- June 2014
- May 2014
- April 2014
- March 2014
- February 2014
- January 2014
- December 2013
- November 2013
- October 2013
- September 2013
- August 2013
- July 2013
- May 2013
- April 2013
- March 2013
- February 2013
- January 2013
- December 2012
- November 2012
- October 2012
- September 2012
- August 2012
- July 2012
- June 2012
- May 2012
- April 2012
- March 2012
- February 2012
- January 2012
- December 2011
- November 2011
- October 2011
- September 2011
- August 2011
- July 2011
- May 2011
- April 2011
- March 2011
- February 2011
- January 2011
- December 2010
- November 2010
- October 2010
- September 2010
- August 2010
- July 2010
- June 2010
- May 2010
- April 2010
- August 2009
- July 2009
- June 2009
- May 2009
- April 2009
- March 2009
- August 2008
- July 2008
- June 2008
- May 2008
- April 2008
- March 2008
- February 2008
- January 2008
- December 2007
- November 2007
- October 2007
- September 2007
- August 2007
- July 2007
- June 2007
- May 2007
- April 2007
- December 2006
- November 2006
- October 2006
- September 2006
-
Categories
- "virtual communities"
- ahm2007
- berlin5
- blueobelisk
- chemistry
- crystaleye
- cyberscience
- data
- etd2007
- fun
- general
- idcc3
- jisc-theorem
- mkm2007
- nmr
- open issues
- open notebook science
- oscar
- programming for scientists
- publishing
- puzzles
- repositories
- scifoo
- semanticWeb
- theses
- Uncategorized
- www2007
- XML
- xtech2007
-
Meta
GIFs are horror in other areas of science and math, too. Most programs that make LaTeX text available on the web use gifs for all of the mathematical equations — yuck! Sometimes there is an alt tag for the image in which some of the information is findable — if you know to search for LaTeX markup. Most scientific papers and websites don’t use MathML or any other searchable format. If you’re a mathematician who knows the name or class of equations, you can search on that. If you need to find an equation of the form x, then you’re out of luck.
(1) Yes! It amazes me how little progress has been made towards universal semantic maths or even universal presentational maths. Back when the Web was bright and shiny and innocent (1994) there was a splendid tool – LaTeX2HTML (Nikos Drakos, Leeds, UK) which did exactly that. It produced GIFs for the maths and that was reasonable at the time. But now we need built-in support for MathML, SVG in browsers and educate the community in the pixel disaster.
One area we are starting to make progress in is “plots” – graphs of y (y1…) against X. Most of these are trashed as PDF or GIF. But they can all be captured in STMML (a subset of CML) and SVG. We hope to make rapid progress here.
“If you need to find an equation of the form x, then you’re out of luck.!”
I agree. I assume there are lots of people who would like to search for (say) first-order partial differential equations in (say) the atmospheric chemistry literature.
Nice demonstrations of the “hamburger effect”. Once data have been “flattened” as bitmaps (especially at low resolution) there isn’t much that can be done to reconstruct the original.
What’s the answer, though? Even SVG has limitations. Currently browser support (and other software support) is limited. A lot of scanning software doesn’t support it. NMR, IR, and chromatography software generally don’t offer an “export as SVG” option either. Finally, awareness of the problem is so low, few see a need to change what they’re doing. And many wouldn’t change even if they knew a problem existed, due to lack of technical capacity and accepted standards.
The successful solution to this problem is probably one in which scientists don’t have to change their current practices. How that actually works technically is an interesting area of research…
Pingback: Unilever Centre for Molecular Informatics, Cambridge - petermr’s blog » Blog Archive » Presentation to Open Scholarship 2006
Great post Peter — this is a great illustration of why not giving out (raw) data is such a problem.
@Rich: I note that SVG support is getting pretty good: Chrome and Firefox have supported for a long time and IE9 is scheduled to include it (and there are also now plenty of workarounds for IE’s lack of support including this wonderful javascript hack from google: http://code.google.com/p/svgweb/)