In the previous post I introduced the need to extract data from plots – I continue with the details of how to do it. (Again, please stay with this even if you aren’t a scientist or geek – the principles are general. And I have a surprise, which surprised even me!).
Looking at PedroS’s problem we’ve narrowed it down to one image and one caption. Note that this single paper could give 20 times this amount of information and there are millions of papers. But we’ll “zoom in” to this single task
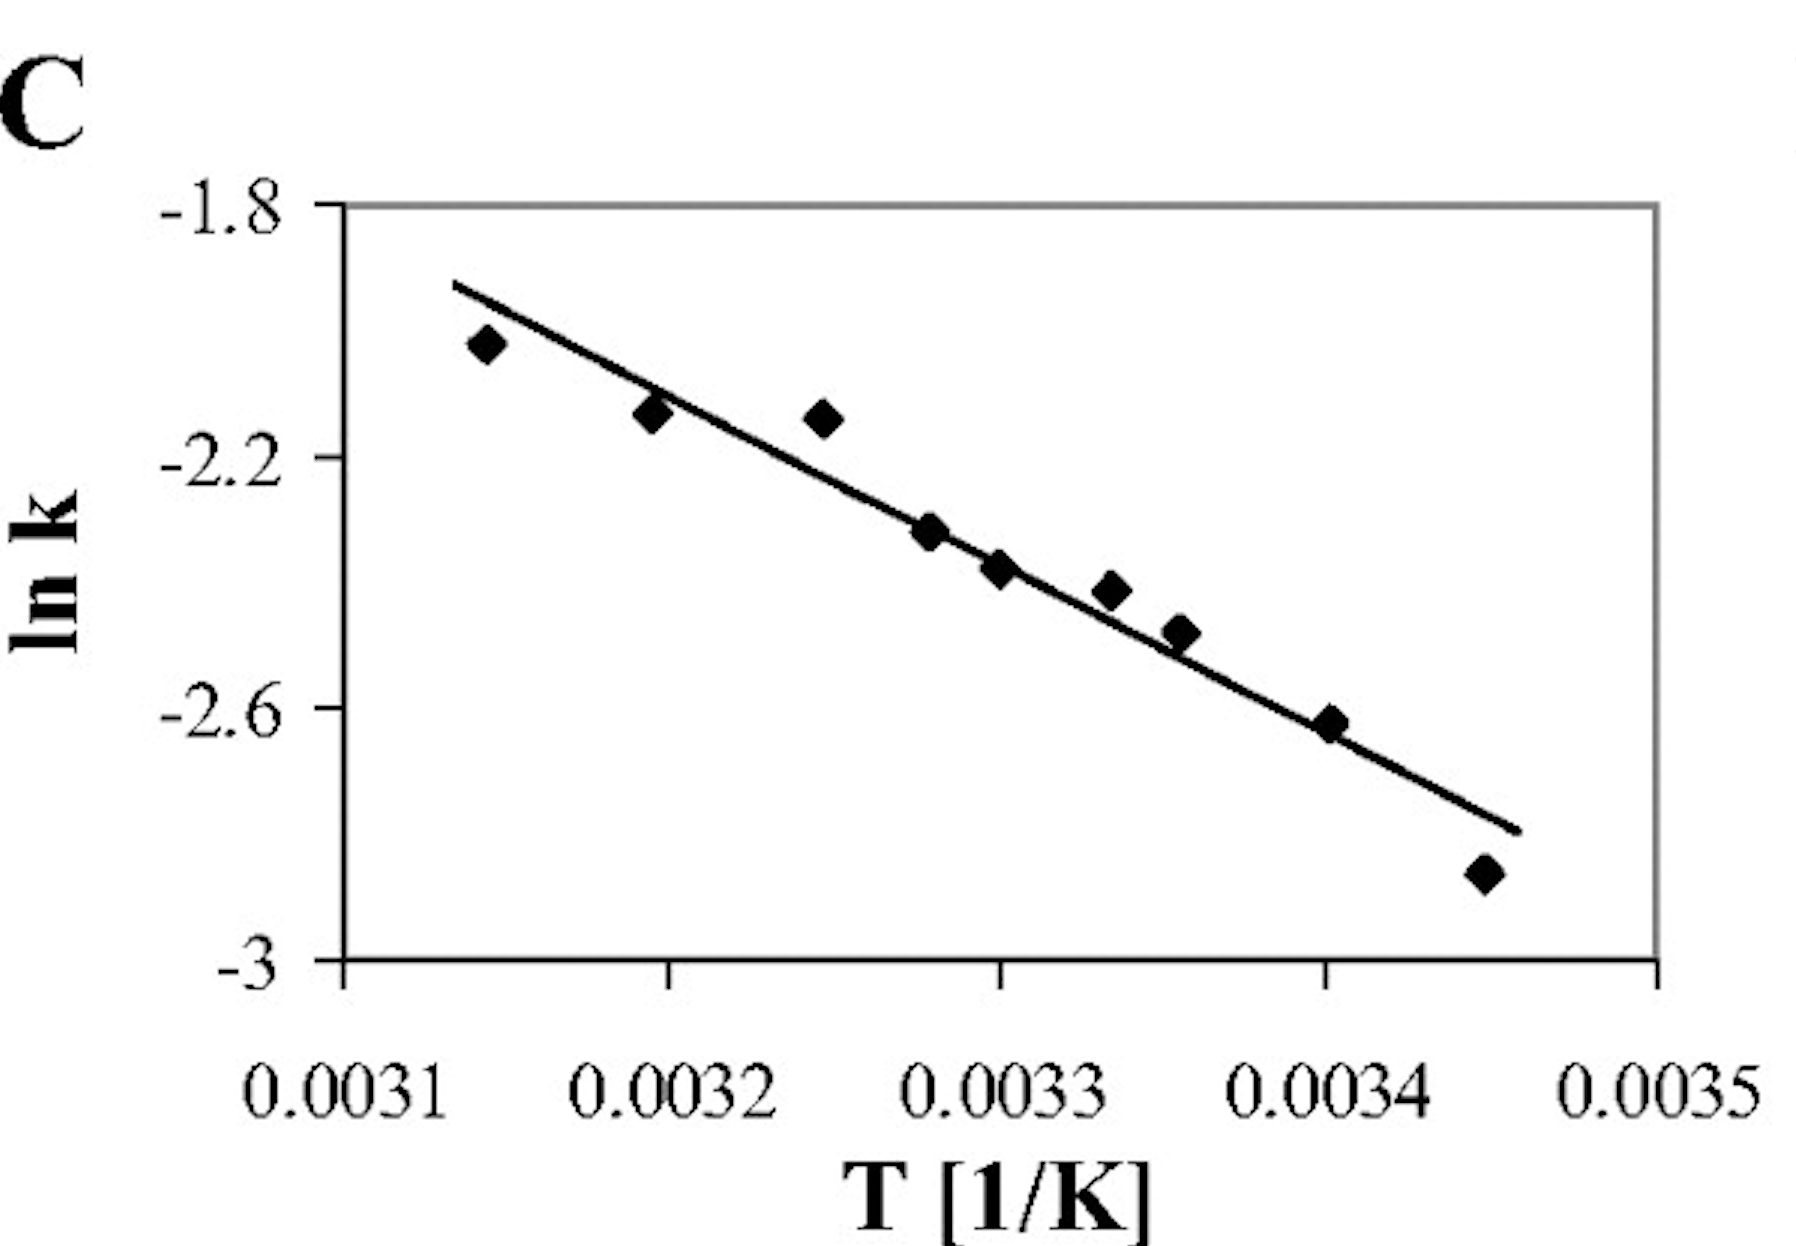
Here’s the image. If you zoom in you’ll see it’s made of pixels
There are no explicit characters or lines – only groups of pixels that represent them. (This is actually very high quality compared with many pictures.) Interpreting them is tricky, but we’ve done most of the hard work (hackers welcome to help!). What we have to do is:
- find the data points (there are 9, represented by diamonds)
- the straight line relationship
- the x-axis
- the x-axis scale (tick marks and numbers 0.0031 -> 0035)
- the x-axis quantity (T)
- the x-axis units (1/K)
- the y-axis
- the y-axis scale
- the y-axis quantity (ln k) – there are no units as logarithms are dimensionless
Knowledgeable scientists will already have spotted there is an error in the plot. An Arrhenius plot should have 1/T, not T as the x-axis. It’s almost certainly a levelling error, not a data error, bt even so it’s an error.
This is the holy “version of record” and it’s wrong!!.
I have asserted that on average every paper contains errors. Not necessarily serious ones, but errors all the same. A graduate student would have to recreate this plot to pass their exam.
Could our AMI program detect this automatically? In principle, yes – quite easily. We’d need a template for “Arrhenius plot” and the dimensions of the x-axis.
So that’s our contention that every paper must be examined by machines for errors. Any publisher who prevents us doing so is trying to support its monopoly at the cost of allowing BAD SCIENCE. That’s why we have a moral right an imperative to use content mining for the whole literature.
To check for errors (and worse).
A publisher who defends their right to condone bad science will lose in the court of public opinion.
(Now, I didn’t know when I started this post that there was an error in it! I’ll continue with what I wanted to say…)
We now have to interpret what the the semantic of the plot are. Let’s look at the caption for (C) and annotate using the Internet and especially Wikipedia.
Wikipedia??? Isn’t that unreliabe and rubbish??
NO. No more so than anything else (remember the current paper has at least one error, that would never persist in Wikipedia). And in science the quality of Wikipedia is extremely high (NB I wrote some of it). So let’s see how much of the caption we can interpret (this has links to Wikipedia, etc.)
determination of the activation energy [http://en.wikipedia.org/wiki/Activation_energy ] of DPOR catalysis. In an Arrhenius plot [http://en.wikipedia.org/wiki/Arrhenius_plot] the logarithm of activity [http://en.wiktionary.org/wiki/catalytic_activity] (ln k, where k is the initial rate [http://chemwiki.ucdavis.edu/Physical_Chemistry/Kinetics/Virtual%3A_Kinetics/Method_of_Initial_Rates] of Chlide formation in the standard DPOR assay) is plotted versus the reciprocal of the absolute temperature [http://simple.wikipedia.org/wiki/Absolute_temperature] in K.
Over half the semantics are precisely described in Wikipedia. In sufficient detail that our program AMI could be taught to understand them. The only things missing are “DPOR” and “Chlide”.
*I* don’t know what they are. There is no shame in ignorance. Can we find out?
They should be mentioned earlier in the paper – let’s scroll back to the abstract…
During chlorophyll and bacteriochlorophyll biosynthesis in gymnosperms, algae, and photosynthetic bacteria, dark-operative protochlorophyllide oxidoreductase (DPOR) reduces ring D of aromatic protochlorophyllide stereospecifically to produce chlorophyllide.
What’s “protochlorophyllide oxidoreductase”? AMI can look in: http://en.wikipedia.org/wiki/Protochlorophyllide_reductase
and Chlide..?? Explained in the introduction:
Protochlorophyllide (Pchlide)2 is a central metabolite for the biosynthesis of chlorophylls (Chl) and bacteriochlorophylls (bChl). In photosynthetic organisms two distinct enzymes catalyze the stereospecific reduction of ring D of the aromatic Pchlide to form chlorophyllide (Chlide) (1–3) (Fig. 1). The first enzyme is the light-dependent Pchlide oxidoreductase (LPOR; NADPH Pchlide oxidoreductase, EC 1.3.1.33).
and this is really valuable. It has an Identifier. An EC number. This highlights the massive work that the biology community has done in providing a semantic infrastructure for public science. Have a look at http://enzyme.expasy.org/EC/1.3.1.33 and marvel at the linked information.
To summarise so far:
Many articles in science are full of semantically supported Facts. There are dictionaries, ontologies and identifier systems. Putting them all together make a vast semantic resource – the Semantic Web. And bioscientists can make massive use of computers – it’s so exciting.
And chemistry? Well the American Chemical Society tried to close Pubchem and threw the lawyers at Wikipedia to preserve its monopoly of information. Which is now about 20 years behind the cutting edge of scientific information.
So please, ACS, have a change of heart and embrace the public value of semantic chemistry. Because it’s going to happen anyway.
In the next post(s) I’ll explain how we get real numbers and labels out of the plot.
An alternative is to do the reproducible research thing and use something like r/ggplot2 or python/matplotlib or Mathematica or whatever and require that charts are generated from a viewable and executable ‘source code’ that is linked from the paper.
If only we could get authors and journals to do this … sigh. Many people have tried and very few have got anywhere. The Int Union of Crystallography is a shining exception. But while journals such as Neuroscience positively forbid the submission of data and Drugmonkey applauds this we have an uphill battle. Meanwhile we can start with the end product without permission and show the value (and shame the authors into better practice)