#ami2 has “solved” the problem of transforming PDFs into SVG and Unicode. “solved” is relative as there is a perpetual increase in non-conformant PDFs with strange fonts, but AMI2 has transformations for the most important. She probably has a conversion rate of better than 99.9%. Now she has to turn these into structured XML.
As before the protagonists are Sleepless (project manager), Chuff (@okfn_okapi, Open enthusiast), #ami2 (semantic expert but no understanding of humans or pragmatics) and PMR (#ignorantchemist).
S: Why is PMR called #ignorantchemist?
PMR: Because the Scholarly kitchen called me that and said I knew nothing about typesetting.
S: Is that true?
PMR: I think I know enough to instruct #ami2.
A: I only understand what PMR tells me in semantic form. It must be deterministic or occasionally controlled stochastics.
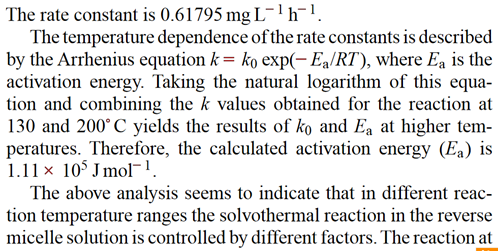
S: Here’s an example. PMR didn’t say where it came from. It probably doesn’t violate copyright.

S: There are 11 lines here…
A: … there are 17 different values of y-coordinate so I count 17 lines.
S: I don’t understand.
A: There is no concept of “line” or “word” in PDF. Only characters at given coordinates. I count each set of characters with the same y-coordinate as a “line”.
C: #ami2 never makes a mistake.
S: what’s the first line, #ami2?
A: spaces “minus (#8722)” “one”, spaces, “minus (#8722)” “one”. They all have y=”343.872″. I put them in order of increasing X-coordinate. There is normally no concept of “space” so this means “estimated disjoint characters”.
C: Why isn’t “The rate constant…” the first sentence?
A: because it has a greater y value. Here is the end of the first line and the start of the next. I’ve simplified it for you.
<text svgx:width=”333.0″ x=”441.801″ y=”343.872″ font-size=”7.074″>−</text>
<text svgx:width=”500.0″ x=”447.319″ y=”343.872″ font-size=”7.074″>1</text>
<text svgx:width=”611.0″ x=”297.915″ y=”347.308″ font-size=”9.465″>T</text>
<text svgx:width=”500.0″ x=”303.698″ y=”347.308″ font-size=”9.465″>h</text>
C: That’s simple???
A: I have removed the font and colour information. “−” is a minus sign. See the font of line 0 is smaller than line 1.
S: Why is the y-coordinate bigger? It’s further down the page.
A: Because SVG has y going DOWN the page…
S: OK. So we have to work out that -1 is a superscript because it’s 3.5 units above the next line and because the font-size is smaller.
A: Yes.
S: And “130 and 200…” has both sub and superscripts. That’s very complicated.
A: once I have been taught complicated things precisely I can do them. PMR has told me what to do with sub/superscripts.
S: so what does this line say?
A: “1”,”3″,”0″ space “2”,”0″,”0″ space SUPERSCRIPT(WHITE_BULLET) “C”
PMR: ARGHHH! That’s an abomination!
S: What’s the problem?
PMR: It is meant to mean “degrees” “C” but they have used the wrong symbol. It should be a degree sign (“°”). There’s a perfectly good Unicode symbol.
S: But the #scholarlykitchen said they are the experts in typesetting and you are #ignorantchemist. And people have paid a lot of money for the typesetting. It is more important to be beautiful than correct.
PMR: Well they have got it wrong. It’s garbage. It’s not even beautiful
S: Please calm down. #AMI2 can you detect when people use superscript(whiteBullet)?
A: Yes.
S: So we can read all the published papers and find the errors. It would be a form of tidy().
C: Yes and provide a service to the world.
PMR: *****
I have used PDFBox to develop a library whose purpose was to extract data tables from PDF files. I recall vividly the anger and frustration it caused to me.
I was facing similar problems (eg. spacing, sub- and superscripts) when deciphering table column headers. But looking back I consider “text analysis” a relatively easy task. It was much more difficult to get the “macro layout” in place. For example, data tables may have different numbers of layout columns, there could be headings for row groups, the cell contents could be wrapped etc. Looking forward to hear about your progress in that area.
And when speaking about #scholarlykitchen quirks, then they often do not draw table borders using single lines of equal length, but combine small line fragments (every one of them displaced from the rest by a tiny fraction of X or Y). Must be the beauty thing.
>>>have used PDFBox to develop a library whose purpose was to extract data tables from PDF files. I recall vividly the anger and frustration it caused to me.
Agreed.
>>>I was facing similar problems (eg. spacing, sub- and superscripts) when deciphering table column headers. But looking back I consider “text analysis” a relatively easy task. It was much more difficult to get the “macro layout” in place. For example, data tables may have different numbers of layout columns, there could be headings for row groups, the cell contents could be wrapped etc. Looking forward to hear about your progress in that area.
It’s not necessarily “my” – you are very welcome to join in , in which case it could be “ours”!
I have no illusions about the horror of this. But I believe that working with SVG as the modelling medium helps and I have a large (open) library.
>>>And when speaking about #scholarlykitchen quirks, then they often do not draw table borders using single lines of equal length, but combine small line fragments (every one of them displaced from the rest by a tiny fraction of X or Y). Must be the beauty thing.
Other beasts-from-the-deep include outlining graphics strokes (i.e.a line is actually a thin closed curve), outline glyphs in graphs, etc. But if we do this communally and in the open there is a fairly finite number of problems.