We’ve got a splendid collection of about 600 Open PDFs for our jailbreak hackathon. They seem to have a medical focus. They are of very variable type and quality. Some are reports, guidelines , some academic papers. Some are born digital but at least one is scanned OCR where the image and the text are superposed. (BTW I am taking it on trust that the papers are Open – some are from closed access publishers and carry their copyright. It’s time we starting marking papers as Open ON THE PAPER).
I have given these to #AMI2 – she processes a paper in about 10 secs on my laptop so it’s just over an hour for the whole lot. That gives me a chance to blog some more. In rev63 AMI was able to do tables so here, without any real selection, I’m giving some examples. (Note that some tables are not recognised as such – especially when the authors don’t use the word “table”. But we shall hack those in time…). Also, as HTML doesn’t seem to have a tableFooter that manages the footnotes I have temporarily added this to the caption as a separate paragraph
From Croat Med J. 2007;48:133-9:
The table in the PDF
AMI’s translation to HTML: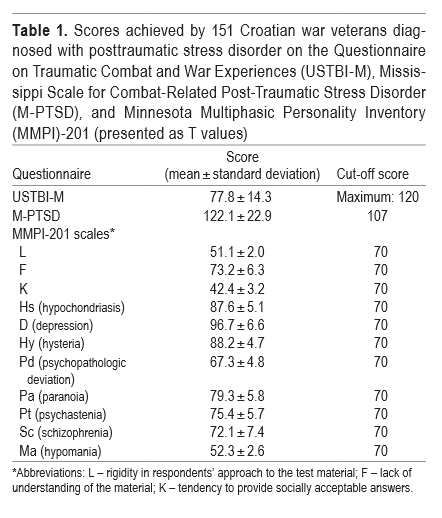
|
Table 1. Scores achieved by 151 Croatian war veterans diagnosed with posttraumatic stress disorder on the Questionnaire on Traumatic Combat and War Experiences (USTBI-M), Mississippi Scale for Combat-Related Post-Traumatic Stress Disorder (M-PTSD), and Minnesota Multiphasic Personality Inventory (MMPI)-201 (presented as T values) *Abbreviations: L – rigidity in respondents’ approach to the test material; F – lack of understanding of the material; K – tendency to provide socially acceptable answers. |
||
|
Score |
||
|
Questionnaire |
(mean ± standard deviation) |
Cut-off score |
|
USTBI-M |
77.8 ± 14.3 |
Maximum: 120 |
|
M-PTSD |
122.1 ± 22.9 |
107 |
|
MMPI-201 scales* |
||
|
L |
51.1 ± 2.0 |
70 |
|
F |
73.2 ± 6.3 |
70 |
|
K |
42.4 ± 3.2 |
70 |
|
87.6 ± 5.1 |
70 |
|
|
96.7 ± 6.6 |
70 |
|
|
88.2 ± 4.7 |
70 |
|
|
67.3 ± 4.8 |
70 |
|
|
79.3 ± 5.8 |
70 |
|
|
Pt ( psychastenia ) |
75.4 ± 5.7 |
70 |
|
72.1 ± 7.4 |
70 |
|
|
52.3 ± 2.6 |
70 |
|
COMMENT: Some of the row labels/ headings are omitted, but I think that can be solved. (Remember this is AMI’s first attempt so we call it alpha)
Here’s another:
And what AMI translates it to
|
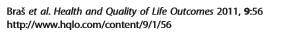
Table 2 The comparison of quality of life among study groups using analysis of variance and post-hoc tests *Group-by-group comparisons that were significant at the level of P < 0.001 performed using LSD (homogenous variance; used for physical and overall quality of life) or Dunnet T3 (unhomogenous variance; all other questions). The significance was set at P < 0.001 in post-hoc test in order to reduce the increased chances of false positive results. |
|||||
|
QOL dimension/status |
Groups |
N |
Mean ± SD |
F; P |
Post-hoc differences* |
|
Physical |
PTSD + LBP (I) |
79 |
75.44 ± 11.33 |
||
|
PTSD (II) |
56 |
78.43 ± 11.54 |
49.18; |
I-III, I-IV, II-III, |
|
|
LBP (III) |
84 |
87.43 ± 13.84 |
< 0.001 |
II-IV, III-IV |
|
|
Controls (IV) |
134 |
94.42 ± 11.65 |
|||
|
Total |
353 |
85.97 ± 14.40 |
|||
|
Psychological |
PTSD + LBP (I) |
76 |
63.74 ± 14.60 |
||
|
PTSD (II) |
58 |
67.45 ± 15.92 |
79.05; |
I-III, I-IV, II-III, |
|
|
LBP (III) |
90 |
80.27 ± 14.59 |
< 0.001 |
II-IV, III-IV |
|
|
Controls (IV) |
132 |
90.67 ± 10.76 |
|||
|
Total |
356 |
78.51 ± 17.44 |
|||
|
Social |
PTSD + LBP (I) |
80 |
33.40 ± 8.89 |
||
|
PTSD (II) |
58 |
35.93 ± 9.98 |
70.19; |
I-III, I-IV, II-III, |
|
|
LBP (III) |
91 |
41.58 ± 8.78 |
< 0.001 |
II-IV, III-IV |
|
|
Controls (IV) |
134 |
49.22 ± 7.13 |
|||
|
Total |
363 |
41.70 ± 10.6 |
|||
|
Enviromental |
PTSD + LBP (I) |
79 |
92.81 ± 20.78 |
||
|
PTSD (II) |
58 |
100.76 ± 19.79 |
66.27; |
I-III, I-IV, II-IV, |
|
|
LBP (III) |
88 |
108.36 ± 17.71 |
< 0.001 |
III-IV |
|
|
Controls (IV) |
130 |
126.06 ± 14.27 |
|||
|
Total |
355 |
110.14 ± 22.02 |
|||
|
Satisfaction with personal health status |
PTSD + LBP (I) |
80 |
1.84 ± 0.74 |
||
|
PTSD (II) |
59 |
2.36 ± 0.85 |
127.48; |
I-II, I-III, I-IV, II-IV, |
|
|
LBP (III) |
95 |
2.70 ± 0.98 |
< 0.001 |
III-IV |
|
|
Controls (IV) |
135 |
4.03 ± 0.85 |
|||
|
Total |
369 |
2.94 ± 1.23 |
|||
|
Overall self-reported quality of life |
PTSD + LBP (I) |
73 |
2.82 ± 1.14 |
||
|
PTSD (II) |
49 |
3.29 ± 1.28 |
24.04; |
I-II, I-III, I-IV, II-III, |
|
|
LBP (III) |
75 |
4.04 ± 1.25 |
< 0.001 |
II-IV |
|
|
Controls (IV) |
42 |
4.48 ± 0.80 |
|||
|
Total |
239 |
3.59 ± 1.31 |
|||
I think she’s got it completely right (the typos “Enviromental” and “Unhomogenous” are visible in the PDF).
AFAIK there is no automatic Open extractor of tables so we are very happy to contribute this to the public pool.