Typed into Arcturus
The more that I read about Climate Change Research the more I find similarities with one of the domains in which I might be called an “expert” – Chem[o]info[r]matics (the o/r are often elided). I’m on the editorial board of J Cheminformatics (http://www.jcheminf.com/ ) which is published by Biomed Central almost all of whose journals are Open Access. (I would not sit on the board of a closed access journal and have publicly resigned from one). I’ll explain later what Cheminformatics is, but I’ll start with a graph that appeared in a peer-reviewed journal in the subject. It’s a serious respected journal and the editors seriously reviewed this submission which makes a serious point. So as not to spoil your voyage of discovery I won’t tell you where it is and I’d ask any chemoinformatics readers of this blog not to blurt out the message. Trust me, it’s relevant to cheminformatics and relevant to ClimateChange. No, I haven’t pasted the wrong graph by mistake.
Please comment on this graph as naturally and lucidly as you feel fit. There is no “right answer”.
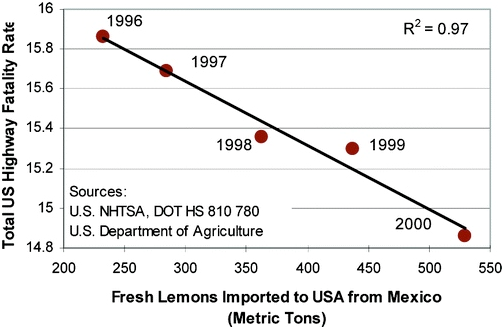
I’m going to assume that the graph shows that is possible to find correlation between two random subjects, but that just having such a plausible case does not make it a fact?
That graph is totally awesome.
I am seriously considering having that graph tattoo’d on my forearm…
It also shows how silly it is to quote R-squared values.
The data sources you site have more years available than the ones you use for this graph and the resulting years are, um, not quite linear 🙂
Correlation does not imply causality. Also see the “Global average temperature vs. Pirates” plot: http://www.venganza.org/images/spreadword/pchart1.jpg