I had hoped to get to the OKF’s Visualisation Workshop but had problems on the Continent so had to miss. Here’s a report:
The first Open Visualisation Workshop took place on Saturday as we mentioned last week.
Details, notes and links are available on the event’s wiki page.
The event took place at Trampoline Systems’ new site in East London. To make sure the event was as informal as it was billed to be – we left the schedule open until the day, so we could see what people were interested in doing and plan the workshop accordingly!
After introductions and some brainstorming, we had impromptu talks and demos from:
- Martin Dittus, last.fm
- Julie Tolmie, Centre for Computing in the Humanities, King’s College London
- Jan Berkel, Trampoline Systems
- Jonathan Lister, Osmosoft
- Gregory Jordan, European Bioinformatics Institute
- David Aanensen, Division of Epidemiology, Public Health and Primary Care, Imperial College London
- Jonathan Gray, The Open Knowledge Foundation (me)
Most of the day was occupied by demos and discussions – so we didn’t get around to doing much tinkering with software packages. However, participants said they found it very useful to see people’s work in other fields – and were keen to continue to meet regularly. It was interesting to see how much commonality there existed between visualisation work in very different fields.
Suggestions for future activities included:
- continuing to build on the list of open source visualisation packages (on the wiki)- possibly including notes, comments and example visualisations from people who have experience using these;
- domain specific sessions (e.g. visualisation for bioinformatics);
- shared project to work on, using open source visualisation software to represent an open knowledge package – e.g. using Prefuse to represent data from omdb
- using different visualisation software to represent the same open dataset – and comparing the results;
- making very brief screencasts of different visualisation projects with voiceovers from their developers;
- promoting the open-visualisation mailing list to researchers, developers and practitioners – as participants weren’t aware of any other general mailing list for open-source visualisation technologies;
- developing a wish-list of features that participants would ideally like to see in open source visualisation software.
It was suggested we have another workshop in June to keep the ball rolling. Nearly everyone there was keen – so we’ve created a doodle page to fix the date.
If you’d like to participate, please:
- add your name to the Open Visualisation Workshop wiki page;
- select which dates you are free on the doodle page;
sign up to the open-visualisation mailing list.
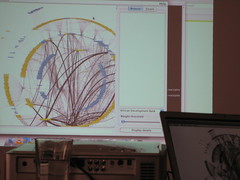
PMR: I have no idea what the visualisation is actually of – maybe readers would like to guess.