Two useful contributions:
Henry flagged up the importance of spin-orbit coupling before we started the calculations. He writes:
the effects can be calculated, and are somewhat basis set dependent. For ourbasis, Br should be corrected by -12 ppm (and approx -24 for two) andCl by -3 ppm. S is probably -2ppm, and Iodine -28 ppm. That shouldprobably suffice for the halogens.
He tells me that it’s possible to calculate the effect exactly but the methodology is current very hairy – running different programs sequentially. So the approximate averages will suffice for now. If they don’t work then we’ll adjust them or go back to calculations.
It’s clear that it’s important from the following:
where the second largest deviation is due to the CBr2 fragment (the largest is the mistranscribed ClCN=O fragment). We shall introduce Henry’s offset’s into the calculations and re-present the data.
These are perceptive and useful points. At present these are being used as a rough guide to identify structures (NOT shifts) with problems. I agree that the skewness for a structure may be important but not yet. (All structures have been fitted to their own means at present as we do not yet know how to treat the offsets – indeed Henry thinks that the calculations for TMS need careful inspection).
Recal that we are fitting the data for each structures separately to:
y = x + c + eps
Here is the spread of the c values (x-axis is 13C ppm):
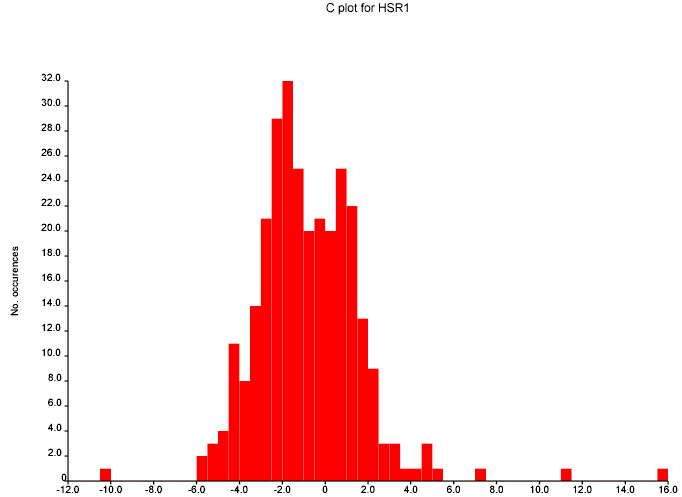
This shows that we are in the right ball park – if we had miscalculated TMS by 10 ppm the data would have been centered round 10. But some of the spread is the systematic errors of the halogens, and others are because of assignment errors in the structures.
So the RMS is a simple measure to identify the potential problems and ask the world to comment.
October 24th, 2007 at 1:08 pm eThe mean and variance assume a normal distribution and are sensitive to outliers. You should use the median and the inter-quartile range. This isn’t a fudge-factor – the values of the mean and variance are misleading when looking at non-normal distributions.
Also, why are you plotting the absolute value rather than the actual value? You are throwing away interesting information by folding +ve and -ve values on top of each other.
This diagram is per structure. Unless you suspect that particular structures have systematic errors, you should also do one per predicted shift. Presumably, particular environments of C atom are more difficult to calculate than others…?