
We use a system called Hobbit to monitor all of the computers in the department. (Catherine wrote about this system not too long ago). In fact, that’s what drives this webpage which tells you the current status of all the IT services in Chemistry. This lets us see all sorts of interesting things about our infrastructure, and it produces lots and lots of graphs!
For example, here’s a graph showing the disk I/O activity on one of the servers which runs multiple Xen virtual machines:
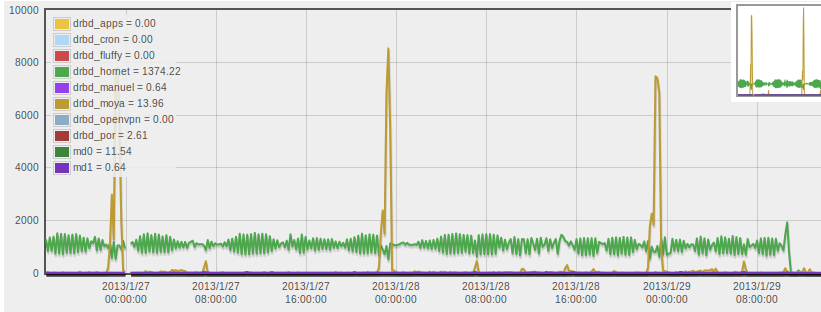
The y-axis on the graph is “transactions per seconds” – roughly, the number of requests to write or read to the disk. The one that’s been interesting me recently is that green line, averaging around 1000 transactions/sec pretty constantly. The fact that the server concerned is constantly accessing the disk is slightly odd.
(Oh, and in case you were wondering, the regular large spikes at midnight in the yellow line arise from a cron job which syncs software packages to some of the clusters in the deptartment.)
It turns out that not only did our Hobbit monitoring let us identify that this is going on, but also it was the cause of all the disk accesses! One part of how Hobbit works is that there’s a client installed on each computer being monitored, and one of the things the client does is scan through the log files so it can report any errors back to the Hobbit server. However, the log files on this server had grown rather big, and so each time the Hobbit client scans them it leads to lots and lots of disk reads – as you can see in the graph above!
As you might be able to tell from the graph, some time this morning I fixed the settings which will now ensure that the log file doesn’t grow to too large a size – the green line dropped pretty much instantly to zero after making the changes, which confirms that the change had the desired effect. So hobbit turned out to simultaneously be the cause of the problem whilst also guiding us towards a solution.